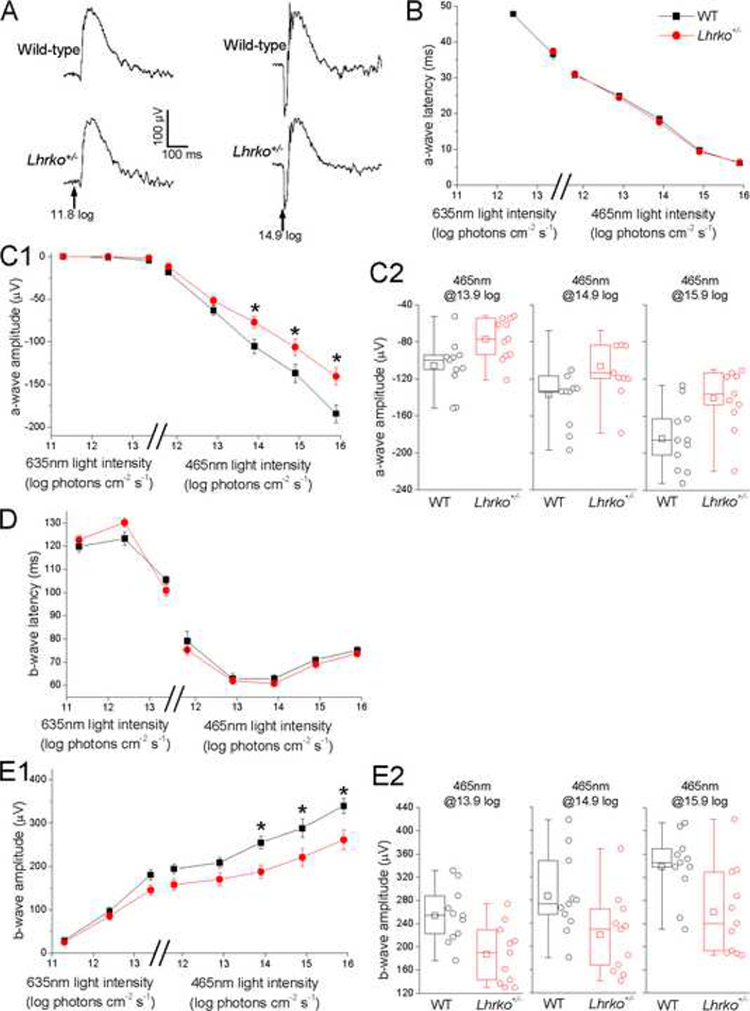
Fig. 1. Photoresponse deficits in Lhrko+/−mice.

A) Examples of wild-type and Lhrko+/− electroretinogram responses to the 465 nm stimulus at 11.8 log (left) and 14.9 log photons cm−2 s−1 (right). Arrows indicate stimulus timing. B-E) Wild-type vs. Lhrko+/− comparisons in a-wave latency (panel B), a-wave amplitude (panel C), b-wave latency (panel D) and b-wave amplitude (panel E). In the plots in panels B, C1, D and E1, the first three stimuli are 635 nm red light while the rest are 465 nm blue light. The error bars represent SEM. *, p<0.05. Panels C2 and E2 show box-and-whisker plots for the three light intensities at which significant wild-type vs. Lhrko+/− differences were found. The lower and upper limits of each box depict the 25th and 75th percentiles. The horizontal line and square indicate the median and the mean, respectively. The ends of the whiskers represent the minimum and maximum of the data. The open circles depict all data points.
