Fig. 4.
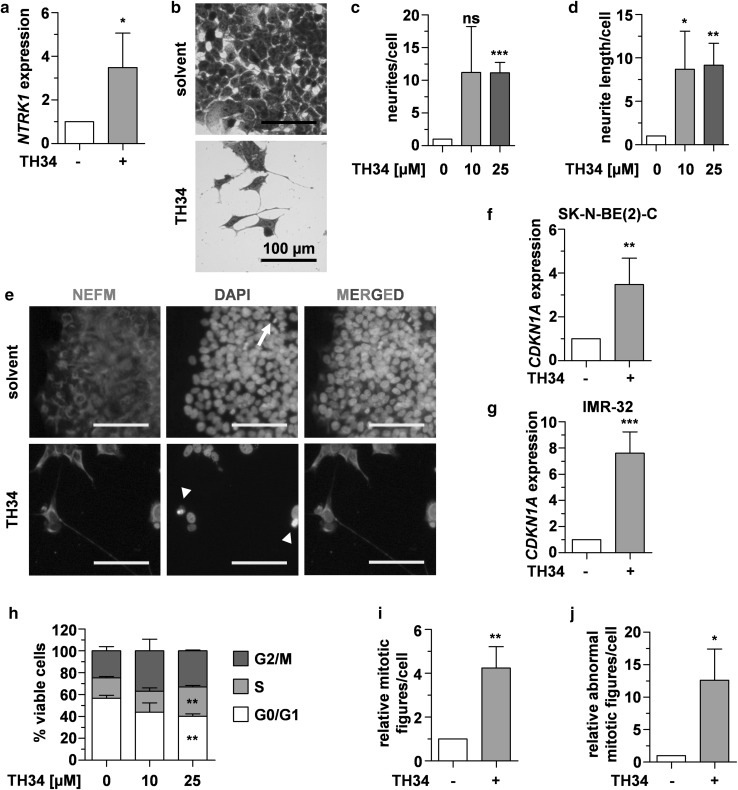
TH34 induces differentiation and cell cycle arrest in neuroblastoma cells. a Relative expression (determined using the 2−ΔΔCt method and normalized to solvent control) of NTRK1 in SK-N-BE(2)-C neuroblastoma cells after 72 h of treatment with TH34 (10 µM). b Representative microscopic images of crystal violet-stained SK-N-BE(2)-C cells treated with TH34 (10 µM) for 6 days. c–d Relative number and length of neurites in SK-N-BE(2)-C cells after 6 days of treatment with indicated concentrations of TH34, quantified using a semi-automated macro determining surface of cell bodies as well as number and length of neurites in ten fields of vision in ImageJ version 1.49v and normalized to solvent control. e Fluorescence microscopic analysis of neurofilament M expression in SK-N-BE(2)-C cells treated with TH34 (10 µM) for 6 days. Nuclei were counterstained with DAPI, arrows and arrowheads indicate normal mitotic and aberrant mitotic nuclei, respectively. Relative expression (determined using the 2− ΔΔCt method and normalized to solvent control) of CDKN1A in SK-N-BE(2)-C (f) and IMR-32 (g) neuroblastoma cells after 72 h of treatment with TH34 (10 µM). h Cell cycle distribution of viable SK-N-BE(2)-C cells in G0/G1 (white), S (light gray) and G2/M (dark gray) phase after 72 h of treatment with indicated concentrations of TH34. i, j Total and aberrant mitotic nuclei in SK-N-BE(2)-C neuroblastoma cells after 6 days of treatment with TH34 (10 µM). In ten fields of vision, all DAPI-stained nuclei and mitotic figures were counted using the Cell Counter Plugin for ImageJ version 1.49v and numbers obtained in treated samples were set in relation to solvent control. Bar graphs represent mean values of at least three independent experiments and statistical analysis was performed using unpaired, two-tailed t test (***p < 0.001; **0.001 ≤ p < 0.01; *0.01 ≤ p < 0.05, ns not significant). Error bars represent SD

