Fig. 5.
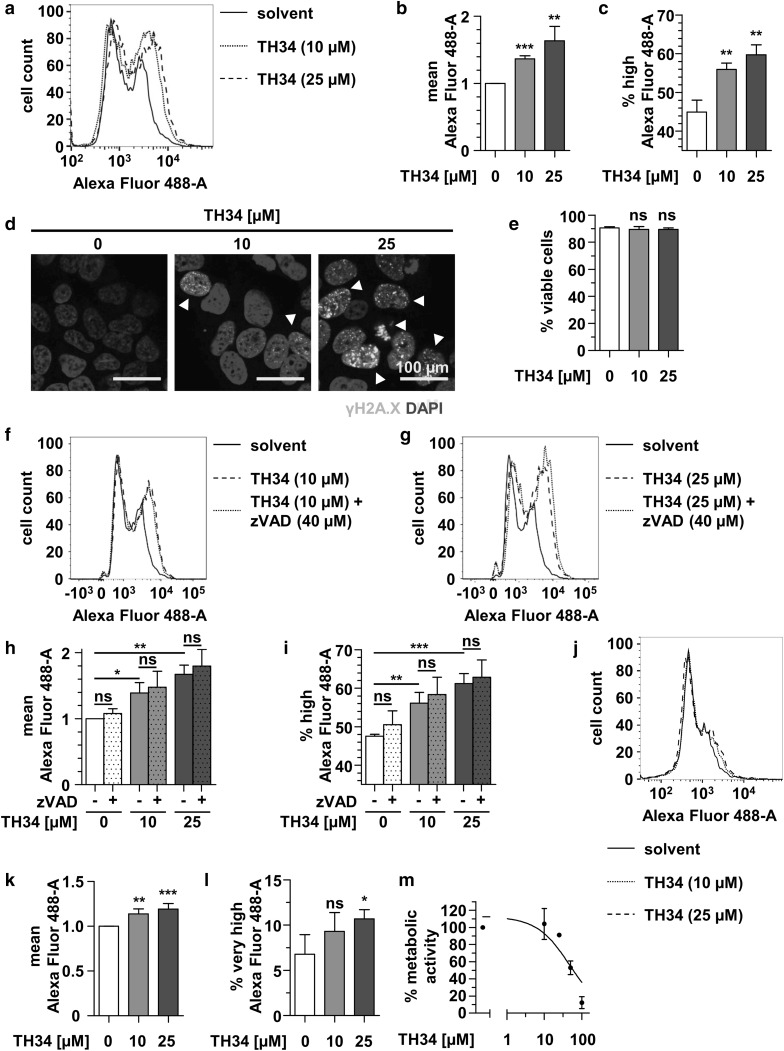
TH34 induces DNA damage in high-grade neuroblastoma cells. a Flow cytometric analysis of H2AX S134 phosphorylation (γH2AX) in fixed, viable SK-N-BE(2)-C cells after 24 h of treatment with indicated concentrations of TH34. Figure shows histogram of logarithmic fluorescence (x-axis) versus event number (y-axis) and gate represents γH2AX-positive cells. Mean Alexa Fluor 488 fluorescence (b) and proportion of γH2AX-positive cells (c) after treatment of SK-N-BE(2)-C cells with different concentrations of TH34 for 24 h. d Immunofluorescence analysis of γH2AX staining on fixed SK-N-BE(2)-C cells after 24 h of treatment with indicated concentrations of TH34. Nuclei were counterstained with DAPI, and arrowheads indicate nuclei with high number of DNA double-strand breaks. e Proportion of dead SK-N-BE(2)-C cells after treatment with different concentrations of TH34 for 24 h, determined via automated trypan blue staining. f, g Flow cytometric analysis of H2AX S134 phosphorylation (γH2AX) in fixed viable SK-N-BE(2)-C cells after 1 h of pre-treatment with Z-VAD-FMK (40 µM) alone and 24 h of additional treatment with TH34 at a concentration of 10 µM (f) or 25 µM (g). Figure shows histogram of logarithmic fluorescence (x-axis) versus event number (y-axis) and gate represents γH2AX--positive cells. Mean Alexa Fluor 488 fluorescence (h) and proportion of γH2AX-positive cells (i) after 1 h of Z-VAD-FMK (40 µM) pre-treatment of SK-N-BE(2)-C cells and additional treatment with different concentrations of TH34 for 24 h. j Flow cytometric analysis of H2AX S134 phosphorylation (γH2AX) in fixed viable NB8 primary neuroblastoma cells after 24 h of treatment with indicated concentrations of TH34. Figure shows histogram of logarithmic fluorescence (x-axis) versus event number (y-axis) and gate represents γH2AX-positive cells. Mean Alexa Fluor 488 fluorescence (k) and proportion of γH2AX highly positive cells (l) after treatment of NB8 primary neuroblastoma cells with different concentrations of TH34 for 24 h. (m) Cellular metabolic activity (CellTiter-Glo) of NB8 primary neuroblastoma cells after treatment with indicated concentrations of TH34 for 72 h. Bar graphs represent mean values of at least three independent experiments and statistical analysis was performed using unpaired, two-tailed t test (***p < 0.001; **0.001 ≤ p < 0.01; *0.01 ≤ p < 0.05, ns not significant). Error bars represent SD

