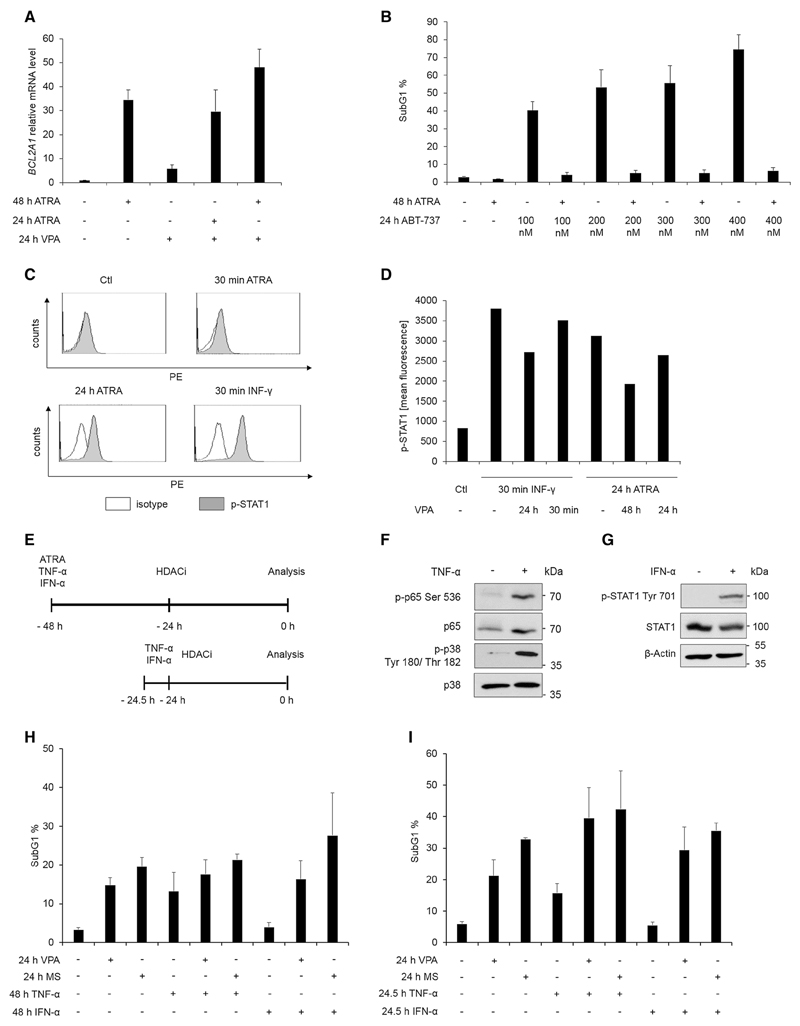
Fig. 2. Activation of NF-κB and STAT1 does not protect NB4 cells from HDACi.
a Cells were treated for the indicated times with 1 µM ATRA and/or 1.5 mM VPA; n = 3. Expression of Bcl2A1 mRNA was analyzed by quantitative real-time PCR. Relative expression relates to corresponding values for samples from untreated cells, set as 1 (mean ± SE). GAPDH, served as reference gene. b SubG1 phase of NB4 cells treated for 48 h with 1 µM ATRA and/or 100–400 nM ABT-737 for 24 h. DNA fragmentation was determined by flow cytometry after PI staining; n = 3. c NB4 cells were stimulated for indicated times with 1 µM ATRA or with 100 ng/ml INF-γ. Cells were incubated with an antibody against the Tyr701-phosphorylated form of STAT1 or an isotype control and analyzed by flow cytometry. Histogram overlays show intracellular p-Tyr 701-STAT1 and were calculated with the Weasel.jar software; n = 2. d NB4 cells were treated for the indicated times with 5 mM valproic acid (VPA), INF-γ (100 ng/ml for 30 min) or ATRA (1 µM for 24 h). Mean fluorescence of intracellular p-Tyr 701-STAT1 stain was quantified by flow cytometry analysis; see Supplemental Fig. S3A for a similar experimental outcome. e Treatment schedule for treatment with ATRA, TNF-α, IFN-α, and HDACi. Cells were either pre-treated for 24 h or for 30 min and then treated for 24 h with HDACi. f NB4 cells were treated for 30 min with 50 ng/ml TNF-α and stained with immunoblot for phosphorylation of NF-κB p65 and MAPK p38; n = 3. g NB4 cells were treated for 30 min with 1000 U IFN-α and analyzed by immunoblot for p-STAT1 and loading controls; n = 4. h Flow cytometry analysis of PI-stained NB4 cells treated as shown in 2e for the indicated times with cytokines (1000 U IFN-α or 50 ng/ml TNF-α) and HDACi [5 mM VPA or 5 µM MS-275 (MS)]; n = 3. i Same as in 2h but with a 30-min pre-incubation with cytokines

