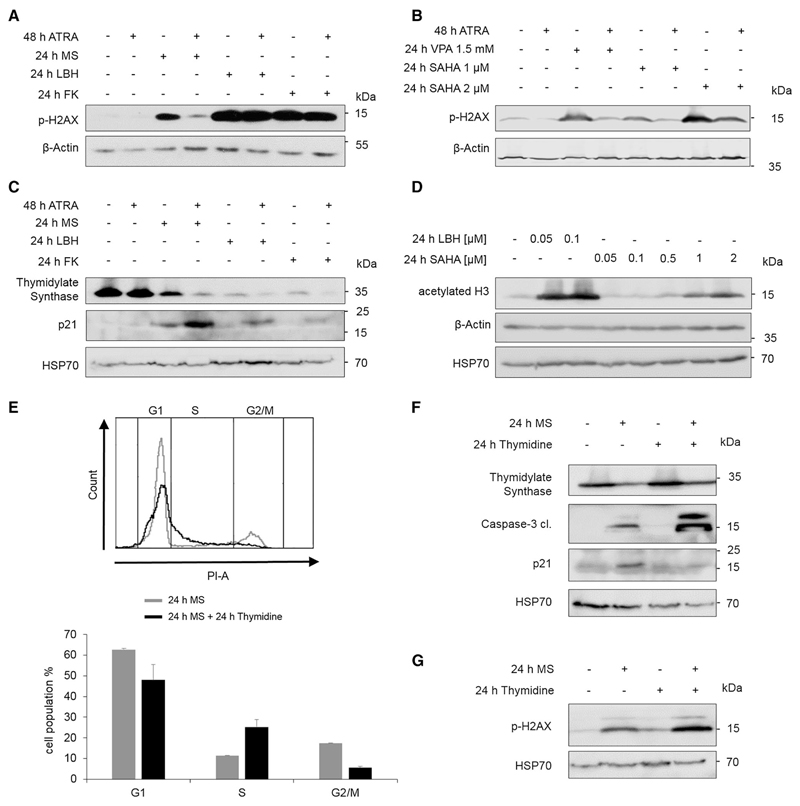
Fig. 5. Cell cycle distribution after HDACi and ATRA.
a–c NB4 cells were stimulated for the indicated times with 1 µM ATRA, 5 µM MS-275, 100 nM LBH589 (LBH),10 nM FK228 (FK) or 1.5 mM VPA or 1–2 µM SAHA, lysed, and subjected to immunoblot. Different membranes with the same samples were used; n = 3. d NB4 cells were incubated for 24 h with the indicated concentrations of LBH589 (LBH) or SAHA and subjected to immunoblot; n = 3. e NB4 cells were treated for 24 h with 5 µM MS-275 (gray) or with MS-275 + 200 µM thymidine (black), stained with PI and analyzed by flow cytometry; n = 2. Shown is a representative flow cytometry profile and a graphical evaluation of the two independent experiments. f–g NB4 cells were treated as described in eand analyzed by immunoblot; n = 2, experiments were done in duplicate

