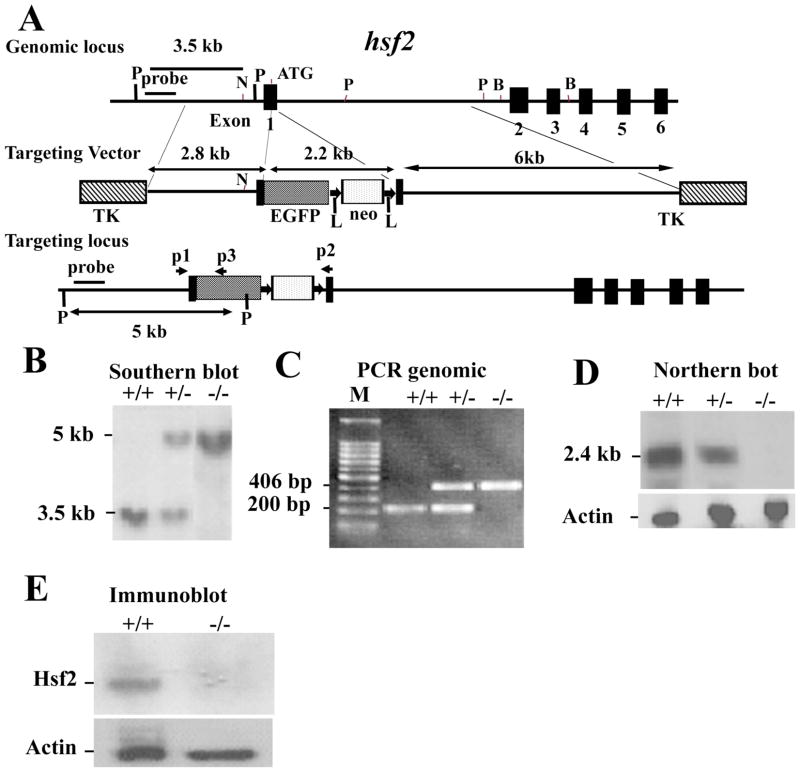
Figure 15-4. Targeting strategy for the hsf2 genomic locus and generation of hsf2-deficient mice.
(A) Restriction map of the hsf2 gene, showing the wild-type allele (top), targeting vector (middle), and the predicted targeted allele following homologous recombination (bottom). The ATG indicates the start codon (top). The position of the EGFP-neo and TK cassettes, probes for Southern blotting, and PCR primers P1, P2, and P3 are indicated. The vectors were designed so that the promoter of hsf2 gene drives EGFP expression. Note that the Pvu II restriction enzyme site located upstream of exon 1 was destroyed in the targeting vector. The restriction enzymes are designated: P, PvuII; N, NheI; B, BamHI 8. (B) Southern blotting analysis of tail DNA derived from wild-type (+/+), heterozygous (+/−) or homozygous (−/−) hsf2 mice. PvuII-digested genomic DNA was hybridized with an external probe to yield bands of 3.5 kb and 5 kb for the hsf2 wild type and targeted loci, respectively. (C) PCR-based genotyping assay amplifies wild-type and targeted hsf2 locus fragments of 200 bp and 406 bp, respectively. (D) Northern blotting analysis. Total RNA extracted from the livers of 8-weeks-old mice of wild-type (+/+), heterozygous (+/−), or homozygous (−/−) for the targeted hsf2 allele adult mice was hybridized with a full-length murine hsf2 cDNA probe. The expected 2.4 kb hsf2 transcript was present in the wild-type and heterozygous mice but absent in mice homozygous for the targeted hsf2 allele. The level of actin mRNA is shown to indicate equal loading of RNA. (E) Western blot analysis. Equal amount of protein from cell extracts from the liver extracts of 8-weeks-old mice of wild type (+/+) or homozygous (−/−) for the targeted hsf2 allele adult mice was analyzed using SDS-PAGE followed by immunoblotting using antibody to Hsf2. The level of actin is shown to indicate equal loading of protein.

