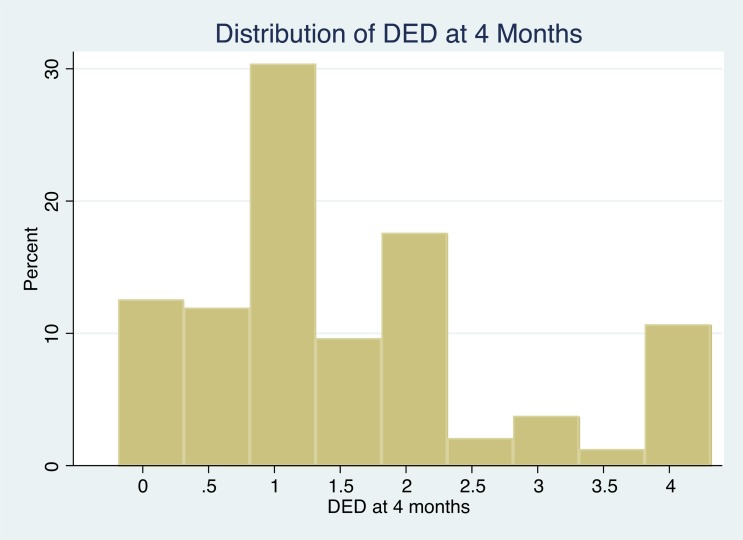
Fig. (1).
Histogram of DED (daily equivalent dose of RAAS-blocking medication) distribution at month 4 (i.e. after dose titration) among 477 participants in HALT PKD Study A. Shown on the X-axis are the dose increments from 0 to the maximum of 4, and on the Y-axis the percentage of participants taking a particular DED.

