
Figure 1. Somitogenesis and Segment Size Scaling.
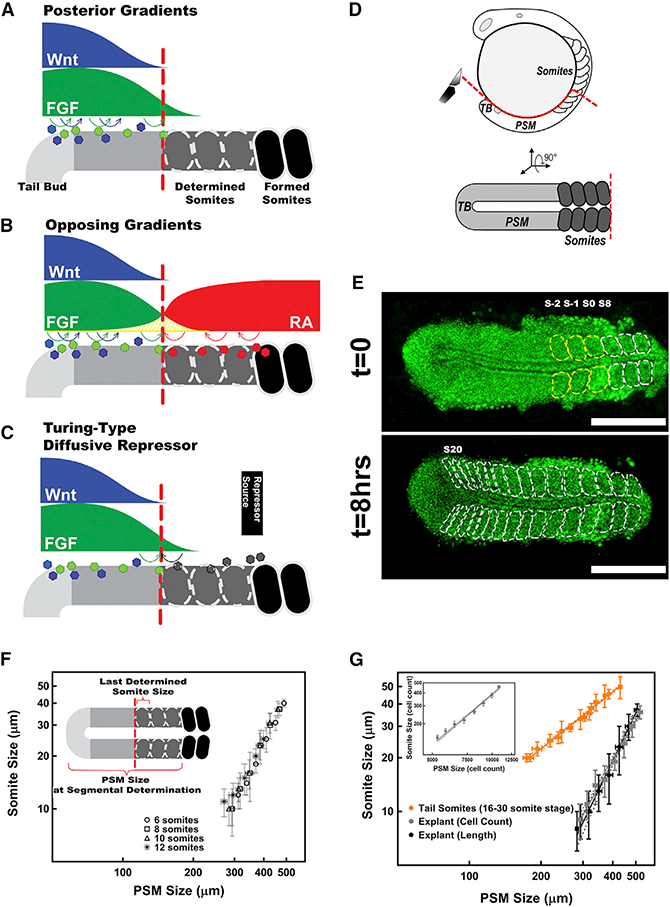
(A-C) Current models explaining how segment sizes are determined: the classical “clock and wavefront” model (A), the “opposing gradients” model (B), and the Turing-type model (C).
(D) Zebrafish embryos (top, lateral view) were cut through red line, and the explants (bottom, dorsal view) were cultured.
(E) A tissue explant (from an 8 somite stage embryo) formed the 3 predetermined somites (yellow dashed lines) followed by 9 progressively smaller somites (white dashed lines) under non-elongation culture over 8 hr. A nuclear-localized GFP marker, in green, was used to count cell numbers. Scale bars, 250 μm.
(F) Somite sizes display the same scaling trend (analysis of covariance [ANCOVA]: F(4,91) = 0.59, p = 0.62) with the PSM sizes in explants started at different stages (n = 6, 7, 7, and 4 for 6, 8,10, and 12 somite stages, respectively).
(G) The size of tail somites scales with the size of PSM at segmental determination in whole zebra fish embryos (orange, n = 5; reanalyzed from Gomez et al., 2008). Length measurement in 1D(black, n = 9) and cell counts in 3D (gray, n = 7). Cell counts in 3D (insert) are converted to 1D length measurements by geometry of the tissue (STAR Methods).
Data are presented with error bars representing the SDs and linear fit of data in logarithmic scale with 95% confidence bands. Posterior is left. See also Figures S1 and S2.