
Figure 2. Posterior Morphogen Gradients Provide Positional Information for Segmental Determination.
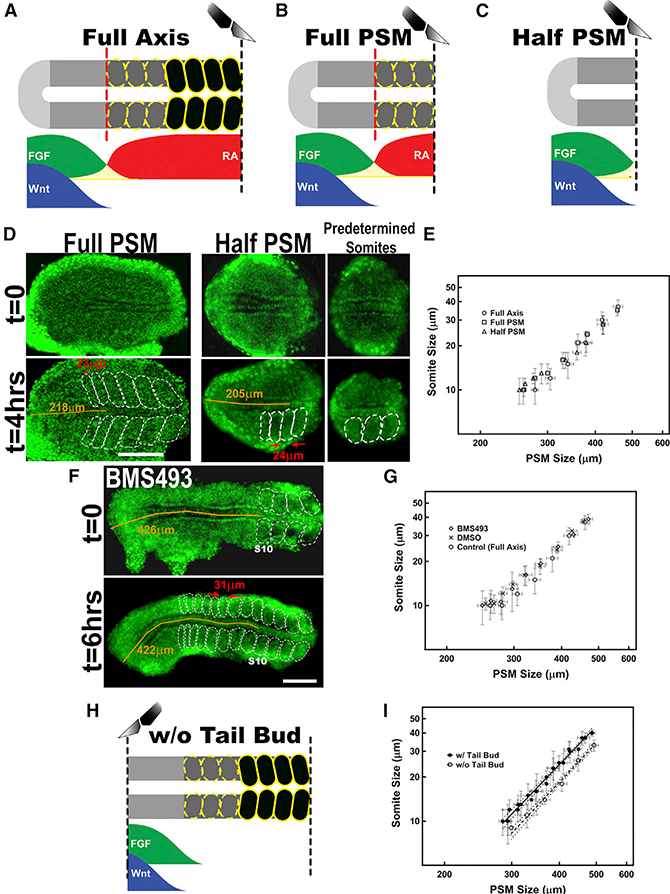
(A-C) Preparing different explants (A, PSM with last formed somites; B, PSM only; and C, posterior half of PSM) alters the effect of anterior RA and/or hypothetical Turing repressor sources.
(D) Afull PSM (left) and a half PSM explant (middle) from 10 somite stage embryos formed similarsized somites at similar PSM coordinates. Images at the beginning of and 4 hr in the explant culture are shown. The predetermined somites, complementary to the half PSM explant, are shown in the right panel. Bright large nuclei flanking lateral to the PSM tissue belong to skin cells.
(E) Full axis (circle), full PSM (square), and half PSM (triangle) explants displayed the same scaling trends (ANCOVA: F(3,201) = 1.2402, p = 0.3).
(F) A full axis explant from a 10 somite stage embryo was continuously treated with BMS493. Images at the beginning of and 6 hr in the explant culture are shown. The size of the first smaller somite scaling with size of the PSM is marked between red arrows.
(G) Explants treated with BMS493 (diamond, n = 9) or DMSO only (cross, n = 5) displayed the same scaling trends with untreated full axis explants (circle) (ANCOVA: F(3,163) = 0.1340, p = 0.9). Error bars indicate SD.
(H) The tail bud is removed to investigate the role of diffusion of posterior gradient ligands in scaling trend.
(I) Scaling trends differed between tailbud removed (hollow circle, n = 14) and control data (full axis, filled circle, n = 9).
Posterior is left. See also Figures S1, S3, and S6.