
Figure 3. Scaling Phenomena Is Explained In Silico by the SFC of Cell Signaling.
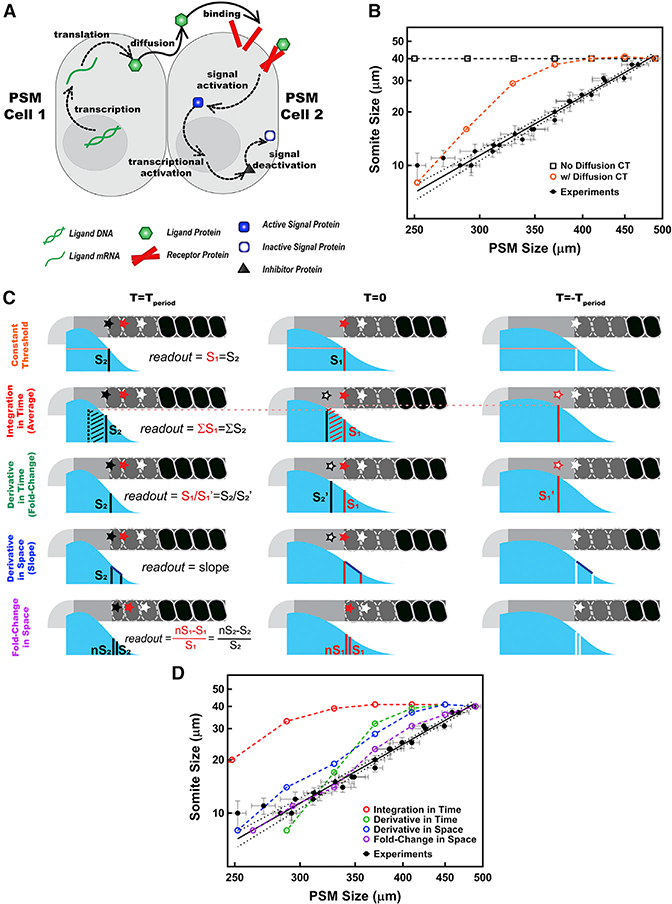
(A) Core posterior signaling network. Only posterior cells transcribe ligand mRNA. Diffusing ligands (green) bind to receptors (red). Formed complex activates the cascade of signal output protein (blue). Activated signal protein (ppERK or nuclear β-catenin) triggers synthesis of its own inhibitor (black). Inhibitor protein in turn deactivates the signal protein.
(B) Constant-threshold model both with (orange) and without ligand diffusion (black squares) failed to reproduce the scaling trend (black solid line for the logarithmic scale linear fit to pooled data from different stages and dotted line for 95% confidence intervals).
(c) Alternative readout models for encoding positional information. Following the arrest of axial elongation (right),determination front on white cell (star shaped) shifts gradually in two clock cycles (from right to left) and falls on the red and black cells (star shaped) consecutively, while both the PSM and the morphogen gradient (cyan) shrink posteriorly.
(D) Positional information encoding by the SFC (purple), but not the temporal integration (red) nor the derivatives in time (green) and space (blue) of signal recapitulates the scaling trend (black). Posterior is left.See also Figure S3.