
Figure 4. Fold Change of FGF Signaling Is Conserved at the Determination Front.
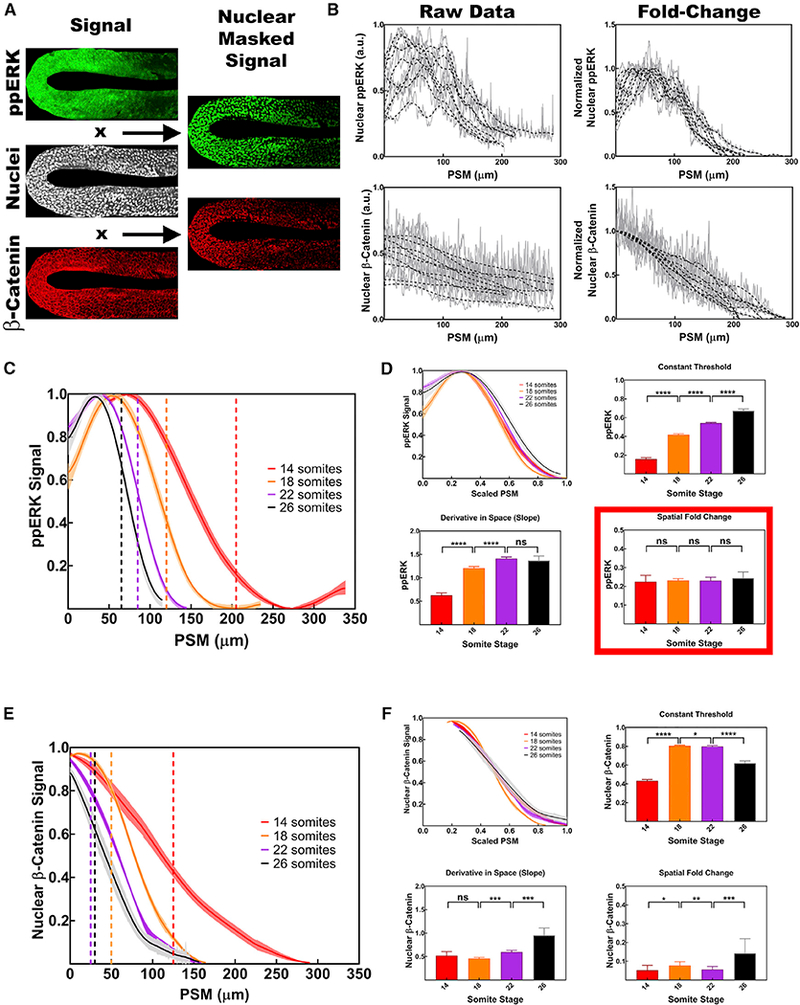
(A) Staining of ppERK (green), β-catenin (red), and Hoechst 33642 (white, used as nuclear mask) at a single z section in the PSM of a 14 somite stage embryo. Nuclear staining of ppERK (green) and β-catenin (red) are shown on the right column.
(B).Embryo-to-embryo variability of signal gradients are significant (left column), whereas normalized gradients (right column) provide a robust signal indicating a fold-change readout mechanism. Raw data (gray lines) are smoothened (black dashed lines).
(C) Normalized levels of ppERK (n = 17, 9, 14, and 13 for 1–4, 18, 22, and 26 somite stages) quantified as FGF signaling output. Posterior end of the PSM are matched for all stages. Determined-undetermined PSM borders are marked by dashed vertical lines with stage matching colors, respectively. Shaded regions represent SEM of data.
(D) FGF signal gradient for different stages scales with the size of the tissue between posterior tip of notochord and anterior end of the PSM indicating a source and sink mechanism. Readouts of FGF signal outputs according to constant threshold, derivative in space, and SFC between neighboring cells. At the determination front (vertical dashed lines in left panels), the SFC of ppERK reads out precisely the same level (22% ± 2%) at different stage embryos.
(E) Normalized levels of nuclear β-catenin (n = 14, 12, 11, and 11 for 14, 18, 22, and 26 somite stages) quantified as Wnt signaling output. Determined undetermined PSM borders for Wnt signaling are marked by dashed vertical lines with stage matching colors, respectively.
(F) Similar to ppERK gradient, nuclear β-catenin gradient scales with the tissue size for different stages. Readouts of Wnt signal outputs according to constant threshold, derivative in space, and SFC between neighboring cells.
Error bars represent SEM. Posterior is left. See also Figures S1, S2, and S4.