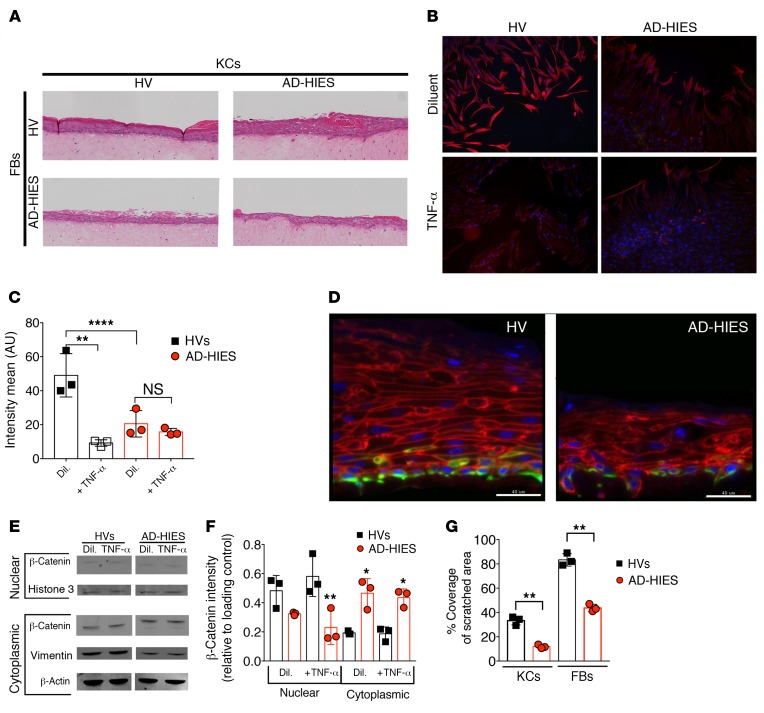
Figure 3. Skin cell cultures from patients with AD-HIES display TNF-α–sensitive defects in wound healing.
(A) 3D organotypic cultures of KCs and FBs from HVs and patients with AD-HIES. (B) IF images (original magnification, ×20) for DAPI (blue) and vimentin (red) and (C) mean intensity of the IF signal of the leading edge of the scratch assay monolayer culture of dermal FBs from HVs and AD-HIES patients. (D) IF images of organotypic cultures, as in A, stained for β-catenin (red), vimentin (green), and DAPI (blue). FBs and KCs were sourced from both HVs and AD-HIES patients, as indicated. Scale bars: 40 μm. (E) Western blot of nuclear and cytoplasmic fractions from KCs obtained from HVs and AD-HIES patients (KCs were cultured with TNF-α or diluent). (F) Band intensity for β-catenin, as in E, normalized to either a histone 3 (nuclear) or β-actin (cytoplasmic) loading control. (G) Area of coverage after 18 to 22 hours of incubation in a scratch assay for KCs (see Supplemental Video 1) and FBs (see Supplemental Video 2). Data are representative of 3 or more independent experiments and displayed as the mean ± SD. n = 3 cell lines per group, indicated by individual dots. Each experiment used at least 2 different cell lines assayed in duplicate. *P < 0.05, **P < 0.01, and ****P < 0.0001, by ANOVA with Bonferroni’s correction, compared with diluent treatment (F), or as indicated. Dil., diluent.

