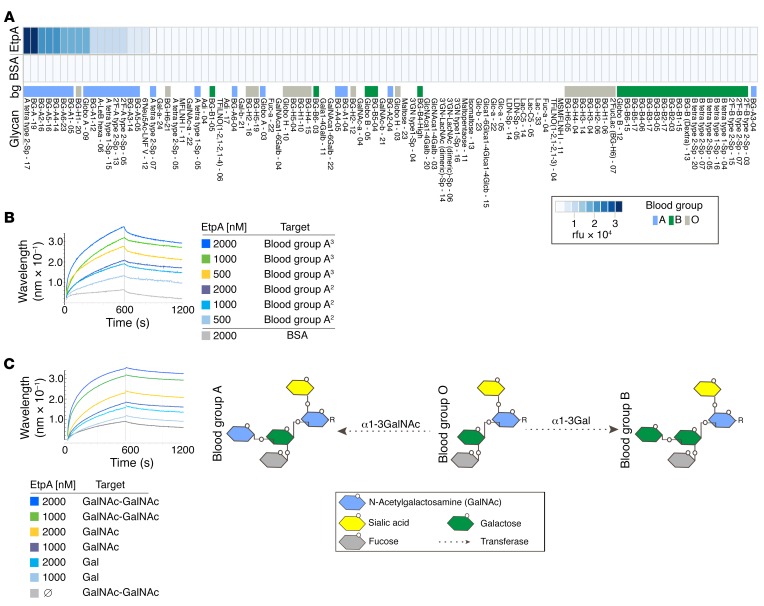
Figure 2. EtpA interacts preferentially with blood group A glycans.
(A) Glycan-array data (top row) demonstrating EtpA binding predominately to blood group A glycans. The top 100 of 411 glycans are ranked in order of diminishing binding activity from left to right. BSA (middle row) is shown as a control. Values represent background-corrected median data from 2 experimental replicates. Distribution of blood group (bg) binding is shown in the bottom row of the figure. Heatmap key (lower right) shows relative fluorescence units (rfu) and coding for blood group antigens. Names for glycans correspond to Supplemental Data Set 1. (B) EtpA binding to blood group A glycans assessed by Bio-Layer Interferometery (Pall ForteBio Corp.) assays. Data are representative of 3 independent experiments. Blood group A3 refers to the biotinylated trisaccharide-PAA conjugate GalNAcα1-3 (Fucα1,2)Galβ-PAA-biotin; blood group A2 refers to the disaccharide conjugate GalNAcα1-3Galβ-PAA-biotin. (C) EtpA binding to terminal GalNAc residues relative to Gal schematic (right) shows structures of blood groups A and B terminating in GalNAc and Gal sugars, respectively. Blood group O (core H) lacks either terminal sugar residue.

