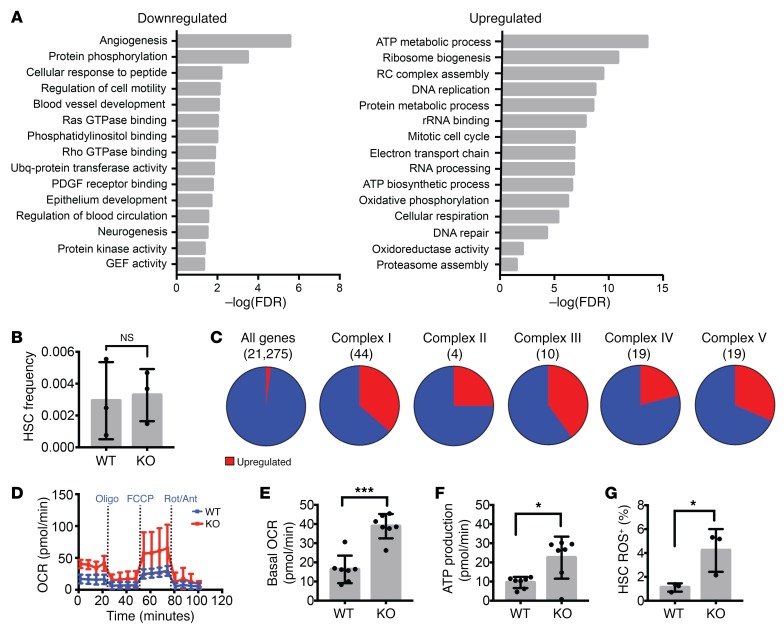
Figure 2. Increased respiration in adult Prdm16-deficient HSCs.
(A) GO pathways significantly up- or downregulated in Prdm16-deficient HSCs. Values expressed as –log10 of the P value, determined by PANTHER analysis. (B) HSC frequency in PB of Vav-Cre–/– Prdm16fl/fl (WT) and Vav-Cre+/– Prdm16fl/fl (KO) mice (n = 3). (C) Fraction of genes upregulated (red) in Prdm16-deficient HSCs among all genes and the 5 respiratory complexes. (D) Extracellular metabolic flux analysis of WT and KO BM HSCs (n = 3 experiments in duplicate, 5 mice per experiment). Rot, rotenone; Ant, antimycin; Oligo, oligomycin. (E and F) Basal oxygen consumption rate (OCR) (E) and respiratory ATP production (F) measured from D (n = 3). (G) ROS measured by the percentage of CellROX Deep Red–positive WT or KO BM HSCs (n = 3). Mean ± SEM. NS, P > 0.05; *P < 0.05; ***P < 0.001; Student’s t test, and χ2 test for observed vs. expected values.

