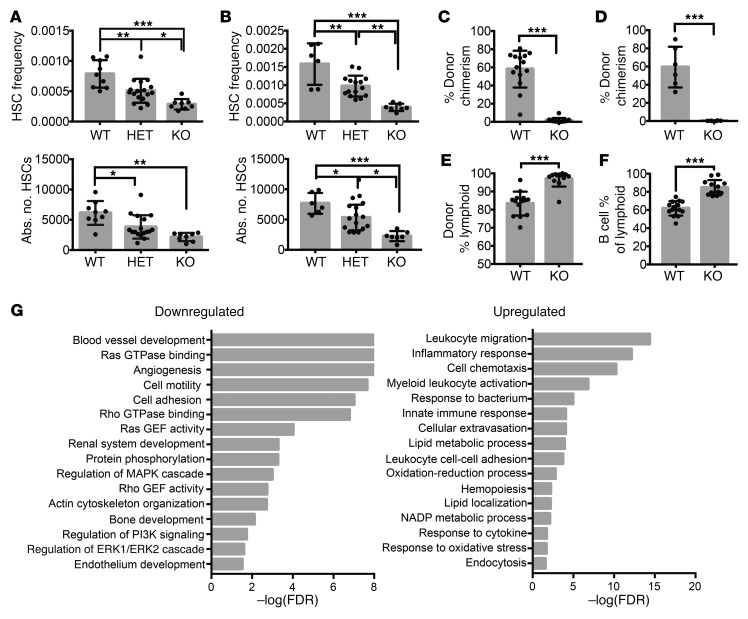
Figure 3. Hematopoietic phenotype of fPrdm16-deficient mice.
(A) HSC frequency and absolute number (Lin–cKit+Sca+Mac1+CD48–CD150+) in FL of Δ47-fPrdm16–/– (KO), Δ47-fPrdm16+/– (HET), and WT littermate mice (n = 34 mice). (B) Analysis of Δ13-fPrdm16–/– mice, performed as in A (n = 28 mice). (C) PB donor chimerism 16 weeks after competitive transplantation of WT or KO FL HSCs (n = 12–14 mice, 3 independent experiments). (D) BM donor chimerism in recipient mice from C 16 weeks after transplantation (n = 6 mice). (E) Percentage lymphoid (CD19+ or CD3+) donor cells in PB from C (n = 12–14). (F) Percentage of B cells (CD19+) among lymphoid cells in E. (G) GO pathways significantly up- or downregulated in Δ47-fPrdm16–/– FL HSCs. Values expressed as –log10 of the P value, determined by PANTHER analysis. Mean ± SEM. NS, P > 0.05; *P < 0.05; **P < 0.01; ***P < 0.001; 1-way ANOVA for multiple comparisons or Student’s t test for single comparisons.

