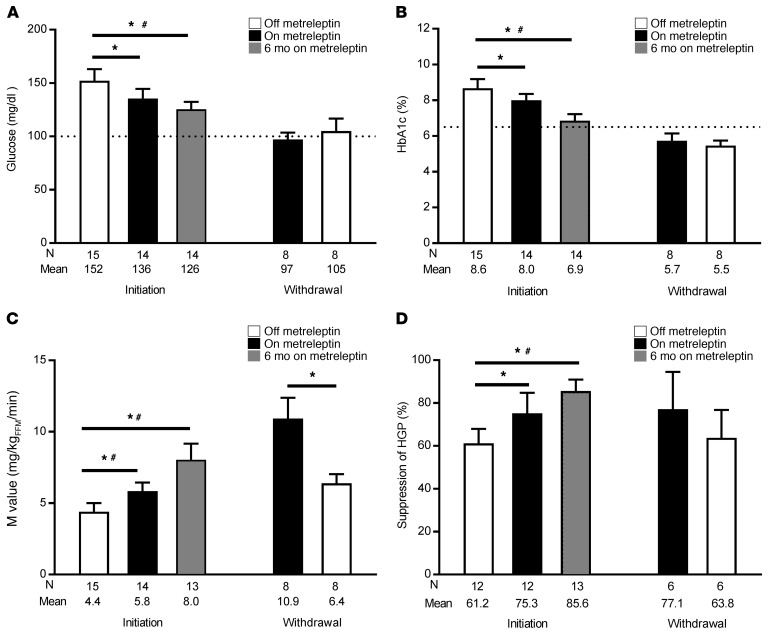
Figure 3. Improvements in glucose control and insulin sensitivity were independent of food intake in humans with lipodystrophy while on metreleptin.
(A) Fasting glucose levels in leptin initiation and leptin withdrawal subjects while off (white bars), on (black bars), and after 6 months on (gray bars) metreleptin. The dotted line indicates of the upper limit of normal (100 mg/dl). (B) HbA1c values. The dotted gray line indicates the threshold for the diagnosis of diabetes (6.5%). (C) Whole-body insulin sensitivity reflected by the M value (hyperinsulinemic-euglycemic clamp). (D) Insulin-mediated suppression of HGP as an indicator of hepatic insulin sensitivity. Data shown represent the mean ± SEM. The study was powered to detect differences between the off- versus on-leptin state (black versus white bars) during constant food intake. *P < 0.05, by 2-tailed t test or Wilcoxon matched pairs, signed-rank test between each pair of time points, based on data distribution. #P < 0.05, by linear mixed model for all 3 time points, with post-hoc pairwise Bonferroni correction in the leptin initiation cohort. N, number.

