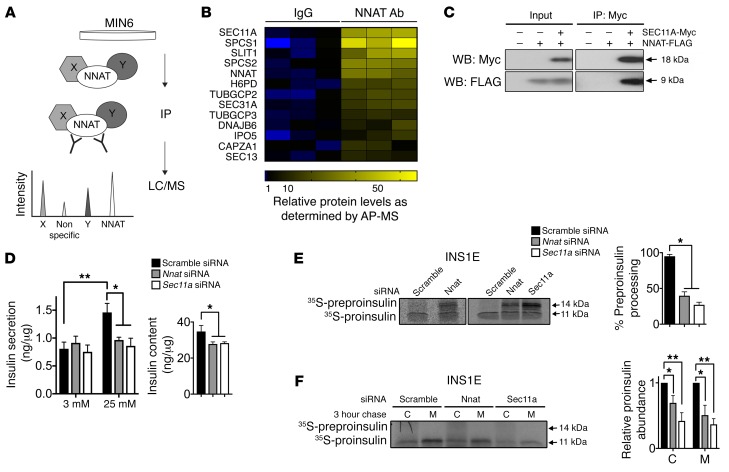
Figure 4. NNAT interaction with the SPC and modulation of preproinsulin handling.
(A) Overview of affinity purification/mass spectrometry (AP/MS) screen for novel interaction partners of NNAT. Endogenous NNAT was immunoprecipitated (IP) from MIN6 cell lysates and interacting partners in co-IPs analyzed by liquid chromatography/mass spectrometry (LC/MS). (B) Heatmap from AP/MS analysis of top protein hits in IPs using antibodies against NNAT (NNAT Ab) and control IPs with rabbit immunoglobulins (IgG). Relatively high abundance is shown in yellow and relatively low abundance in blue. (C) Lysates from HEK293T cells expressing c-Myc–tagged SEC11A and FLAG-tagged NNAT were immunoprecipitated using anti–c-Myc antibodies. Proteins in input and IP samples were detected by Western blotting using anti–c-Myc and anti-FLAG antibodies. Panel shows a representative blot of 3 independent experiments. (D) INS1E cells transiently transfected with siRNA targeting Nnat or Sec11a were assayed in vitro for GSIS at low (3 mM) and high (25 mM) glucose. A scramble siRNA served as a control with data expressed as mean insulin secretion per unit cellular protein. Graph on the right shows total insulin content in cell lysates. (n = 9 independent cultures per group, 3 independent experiments, 2-way ANOVA [left graph] and 1-way ANOVA [right graph].) (E) INS1E cells transfected with c-Myc–tagged preproinsulin and siRNAs targeting Nnat or Sec11a were pulse-labeled with 35S-Cys/Met. Lysates immunoprecipitated with anti–c-Myc agarose were analyzed by autoradiography. Associated bar chart shows preproinsulin and proinsulin band intensities in multiple experiments quantified by densitometry and expressed as percentage processing of preproinsulin (n = 3 cultures per group from 3 independent experiments, 1-way ANOVA). (F) Similar experiments performed as in E, from 3-hour chase cell lysates (C) and media (M), quantified as in E (n = 4 cultures per group from 3 independent experiments, 1-way ANOVA for both C and M). (*P < 0.05, **P < 0.01).

