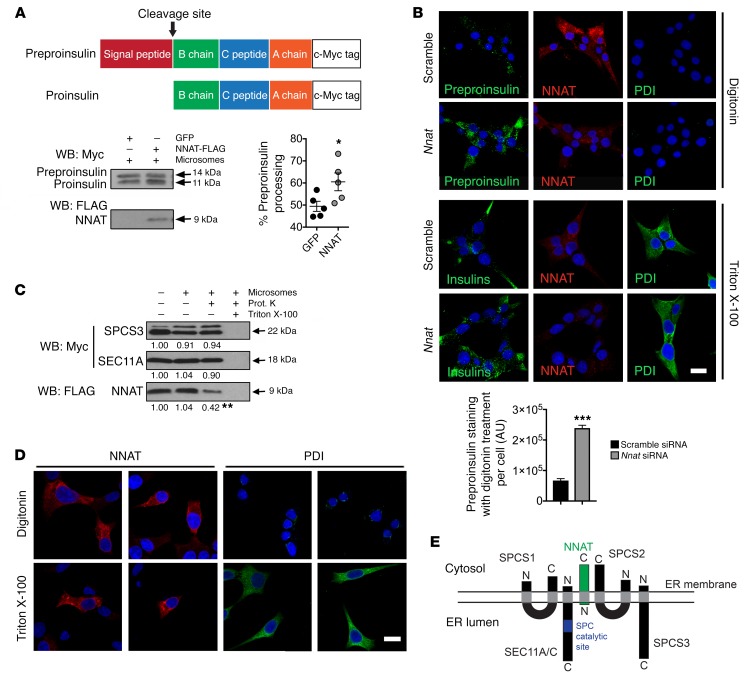
Figure 5. ER membrane topology of NNAT and its direct effect on SPC processing.
(A) Representative Western blotting analysis of in vitro–translated preproinsulin converted to proinsulin in the presence (+) of pancreatic microsomes with and without coexpression of NNAT, expressed as percentage processing of preproinsulin. Coexpression of GFP was used as a control (n = 5 reactions per group, *P < 0.05, Mann-Whitney U test). (B) INS1E cells with Nnat siRNA knockdown versus scramble siRNA control were permeabilized with digitonin or Triton X-100, immunostained using an antibody that detects all insulin species (Insulins, green) and also NNAT (red), and visualized by confocal microscopy. The luminal ER protein PDI (green) was used to assess membrane permeabilization, and nuclei were visualized with DAPI. Scale bar: 10 μm. Fields of view were quantified for total fluorescence using ImageJ (NIH) from insulin-stained cells permeabilized with digitonin and normalized to cell number (Student’s t test, ***P < 0.001). (C) Representative Western blotting analysis of C-terminal c-Myc–tagged SPCS3 and SEC11A, and FLAG-tagged NNAT translated in vitro in the presence (+) or absence (–) of pancreatic microsomes and treated with proteinase K (Prot. K) (n = 3 reactions per group, mean vs. absence of microsomes, **P < 0.01, Student’s t test vs. presence of microsomes). (D) Immunofluorescent staining of INS1E cells permeabilized with digitonin or Triton X-100 with use of antibodies against NNAT (red) and PDI (green) visualized by confocal microscopy. PDI was used to assess membrane permeabilization, and nuclei were visualized with DAPI. Scale bar: 10 μm. (E) Topology of NNAT (green) and subunits of the SPC (black) on the ER membrane. The catalytic site for signal peptidase cleavage in SEC11A/C is shown in blue (N and C, amino- and carboxy terminal, respectively).

