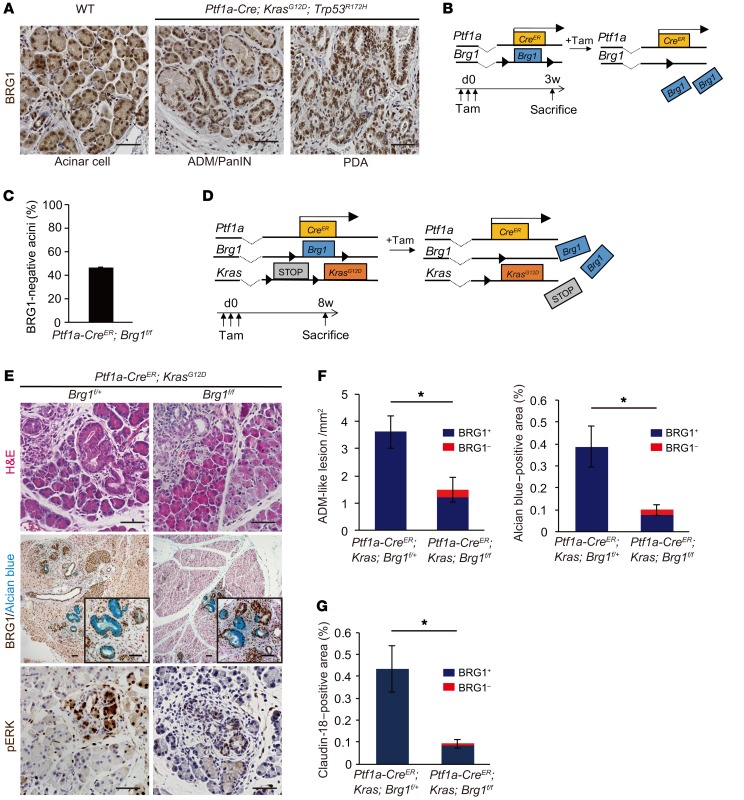
Figure 1. Acinar-specific ablation of Brg1 attenuates oncogenic KRAS-driven ADM and PanIN formation.
(A) Immunohistochemistry for BRG1 in adult Ptf1a-Cre; KrasG12D; Trp53R172H mice. Scale bars: 50 μm. (B) The genetic strategy for determining the efficiency of acinar cell–specific Brg1 deletion following tamoxifen (Tam) induction and the experimental design for tamoxifen administration and analysis. (C) Deletion rate of BRG1 in Ptf1a-CreER; Brg1fl/fl mice at 3 weeks after tamoxifen administration. n = 3 mice. Data are shown as mean ± SEM. (D) The genetic strategy used to delete Brg1 and activate oncogenic Kras in adult pancreatic acinar cells and the experimental design for tamoxifen administration and analysis. (E) H&E staining and immunohistochemistry for BRG1 with Alcian blue and phospho-ERK staining in Ptf1a-CreER; KrasG12D; Brg1fl/fl mice with littermate controls. Scale bars: 50 μm. (F) Quantification of Alcian blue–negative ADM-like lesions and Alcian blue–positive late ADMs and PanINs in Ptf1a-CreER; KrasG12D; Brg1fl/fl mice with littermate controls. Red bars show incidence of BRG1-negative late ADMs and PanINs. n = 3–4 mice per genotype. Data are shown as mean ± SEM. *P < 0.05, Student’s t test. (G) Quantification of PanINs in Ptf1a-CreER; KrasG12D; Brg1fl/fl mice with littermate controls. Claudin-18–positive area was counted. Red bars show incidence of BRG1-negative PanINs. n = 4 mice per genotype. Data are shown as mean ± SEM. *P < 0.05, Student’s t test.

