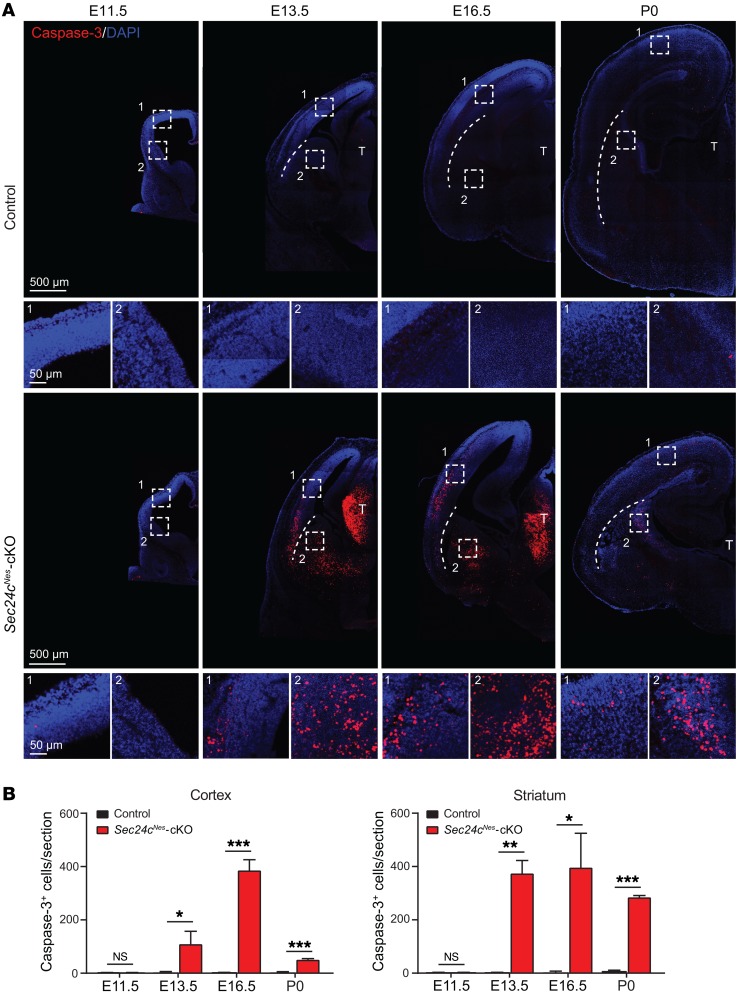
Figure 3. Sec24c deficiency leads to widespread apoptotic cell death in embryonic brains.
(A) Representative images of cleaved caspase-3 staining in brains from control and Sec24cNes-cKO mice at E11.5, E13.5, E16.5, and P0. Magnified areas from cortex (boxed area 1) and striatum (boxed area 2) are also shown. Scale bars: 500 μm (A) and 50 μm (A, insets). (B) Number (mean ± SEM) of caspase-3+ cells in the cortex and striatum in brains from control and Sec24cNes-cKO mice at E11.5, E13.5, E16.5, and P0. n = 3 for each genotype at each age. *P < 0.05, **P < 0.01, and ***P < 0.001, by Student’s t test.

