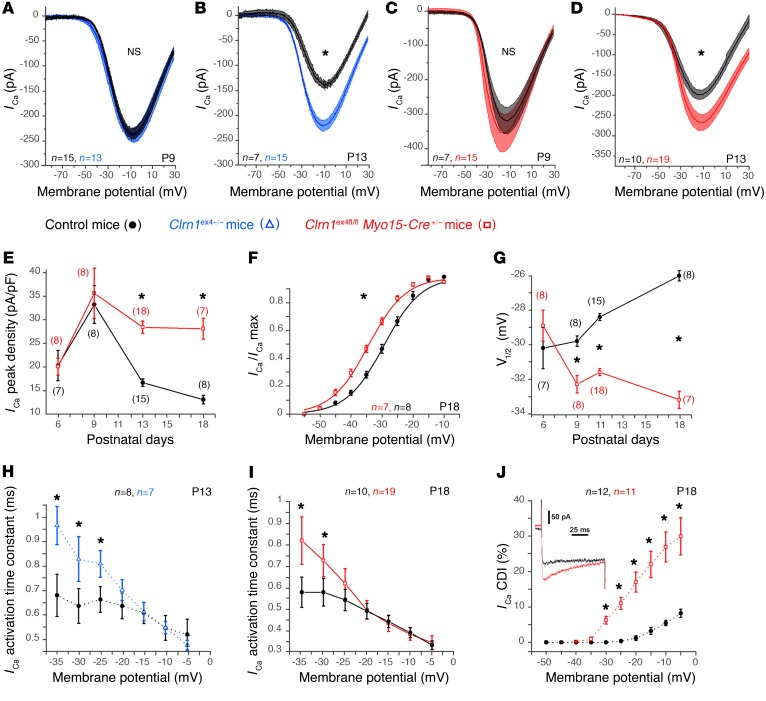
Figure 4. Abnormal Ca2+ currents in mutant IHCs lacking clarin-1.
(A–D) Ca2+ currents in IHCs were activated with a depolarizing voltage-ramp protocol (1 mV/ms) from –90 to +30 mV. The amplitude of Ca2+ currents is normal on P9, but larger in Clrn1ex4–/– (blue curves, A and B) and Clrn1ex4fl/fl Myo15-Cre+/– (red curves, C and D) mice than in controls (black curves, A–D) on P13. (E) Comparative change in peak Ca2+ current density (peak ICa2+ at –10 mV normalized with respect to cell size) with age, at pre- and post-hearing stages (from P6 to P18), in IHCs from Clrn1ex4fl/fl Myo15-Cre+/– mice and control mice. (F) Boltzmann fit of the I-V curve for IHC Ca2+ currents (100-ms voltage steps) in Clrn1ex4fl/fl Myo15-Cre+/– and control mice on P18. (G) Comparative change in the half-maximal activation voltage of ICa2+ (V1/2) before and after hearing onset (from P6 to P18) in IHCs from Clrn1ex4fl/fl Myo15-Cre+/– and control mice. (H and I) ICa2+ activation time constant measured for various voltage steps from a holding potential at –80 mV in IHCs of P13 Clrn1ex4–/– mice (H), P18 Clrn1ex4fl/fl Myo15-Cre+/– mice (I), and the corresponding control mice. (J) IHCs from P18 Clrn1ex4fl/fl Myo15-Cre+/– (red) and control (black) mice were subjected to voltage steps from –80 mV to various membrane potentials for 100 milliseconds (inset: current traces for a Clrn1ex4fl/fl Myo15-Cre+/– mouse and a control mouse). The current reduction at the end of the 100-millisecond step (Ca2+-dependent inactivation, CDI) is expressed as a percentage of ICa2+ peak (%): CDI = [ICa2+ peak – ICa2+ 100 ms]/ICa2+p eak. The values shown are means ± SEM. *P < 0.05 (E–J, Student’s t test with Welch’s correction; and A–D, 2-way ANOVA); n, number of cells.

