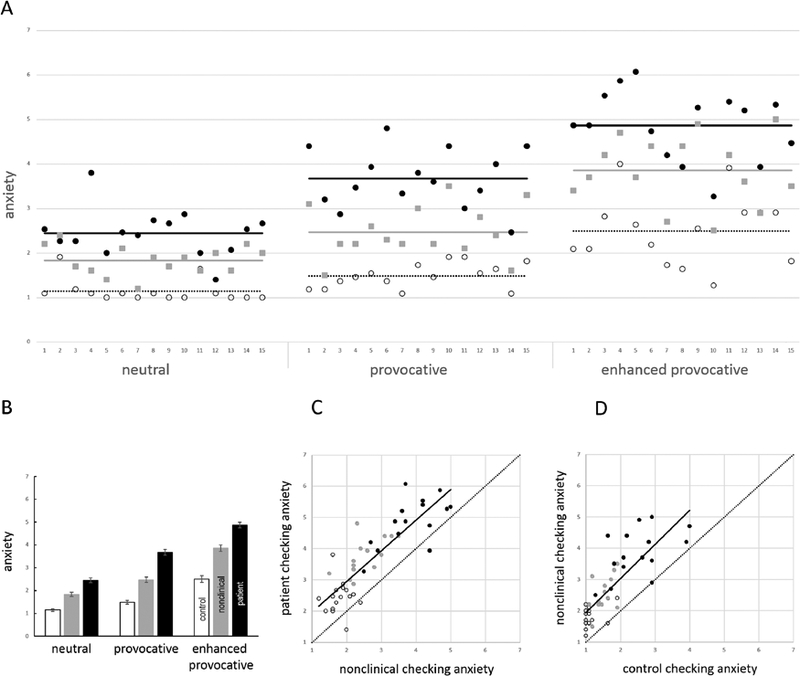
Figure 3.

Effects of group and stimulus type on anxiety (panels A and B) and correlations of anxiety ratings between groups (panels C and D). (A) Plot showing anxiety ratings of control participants (empty circles), participants with nonclinical checking (grey squares), and participants with OCD (black circles) across all images in the neutral, provocative, and enhanced provocative categories (left to right). (B) Mean anxiety ratings for control participants (white), participants with nonclinical checking (grey), and participants with OCD (black) for images in the neutral, provocative, and enhanced provocative categories (left to right). (C, D) Scatter plots of anxiety ratings of participants with OCD versus participants with nonclinical checking (panel C), and of anxiety ratings of participants with nonclinical checking versus control participants (panel D). The solid line indicates the line of best fit; the dotted line shows the line x=y. In both cases, note that the line of best fit is approximately parallel to x=y, but raised, indicating consistently greater anxiety both in the OCD group compared to the nonclinical checking group (panel C), and in the nonclinical checking group compared to the control group (panel D). In both panels C and D, anxiety ratings for the different stimulus types are color coded, with enhanced provocative images (black circles) tending to elicit the most anxiety, followed by provocative images (grey circles), followed by neutral images (empty circles).
