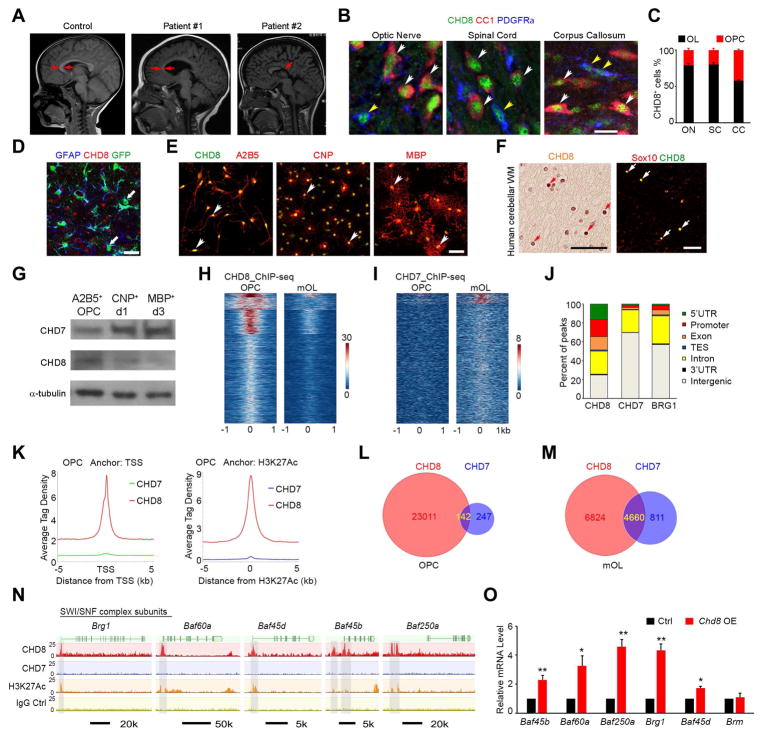
Figure 1. CHD8 is enriched in oligodendrocyte lineage cells and targets SWI/SNF complex genes.
(A) Representative T2-weighted magnetic resonance imaging (MRI) scans of cortices in normal subject (2 year old) and ASD individuals carrying CHD8 disruptive mutations (patient #1, c.5391 A>T, splicing site mutation (2 year old); patient #2, missense mutation c.3485 T>C (p.L1162P); 5 year old). Arrows indicate the corpus callosum.
(B) Co-immunolabeling of CHD8, PDGFRα, and CC1 on the CNS regions of wild-type mice at P14. Yellow and white arrowheads indicate co-labeled PDGFRα+ and CC1+cells, respectively. Scale bar, 10 μm.
(C) CC1+ or PDGFRα+ cell numbers among total CHD8+ cells in the optic nerve, spinal cord, and corpus callosum.
(D) Immunostaining for CHD8 and GFAP in the P14 GFAP-GFP mouse corpus callosum. Arrow indicates GFAP+ astrocytes. Scale bar, 50 μm.
(E) Immunolabeling of CHD8, A2B5, CNP, and MBP in cultured rat oligodendrocytes. Scale bar, 50 μm.
(F) CHD8 and Sox10 immunostaining in oligodendrocytes (arrows) of the human cerebellar white matter. Scale bar, 50 μm.
(G) Immunoblotting of CHD8 and CHD7 in cultured OPCs and differentiating oligodendrocytes at day 1 (d1) and day 3 (d3) after T3 treatment.
(H, I) ChIP-seq density heatmaps for CHD8 (H) and CHD7 (I) within ± 1 kb of the CHD8 peak center in OPCs and mOLs.
(J) Histogram showing the distribution of CHD8, CHD7, and BRG1 binding peaks in the genome of OPCs.
(K) The signal density of CHD8 and CHD7 peaks plotted relative to TSS sites and H3K27Ac peaks.
(L, M) Venn diagrams showing overlap of CHD8 and CHD7 peaks in (L) OPCs and (M) mOLs. (N) CHD8 or CHD7 binding on SWI/SNF complex genes.
(O) Relative expression of SWI/SNF component mRNAs in CG4 cells transfected with control or Chd8 overexpression vectors (n = 3 independent experiments; * p < 0.05 and ** p < 0.01, two-tailed unpaired Student’s t test).
See also Figure S1.

