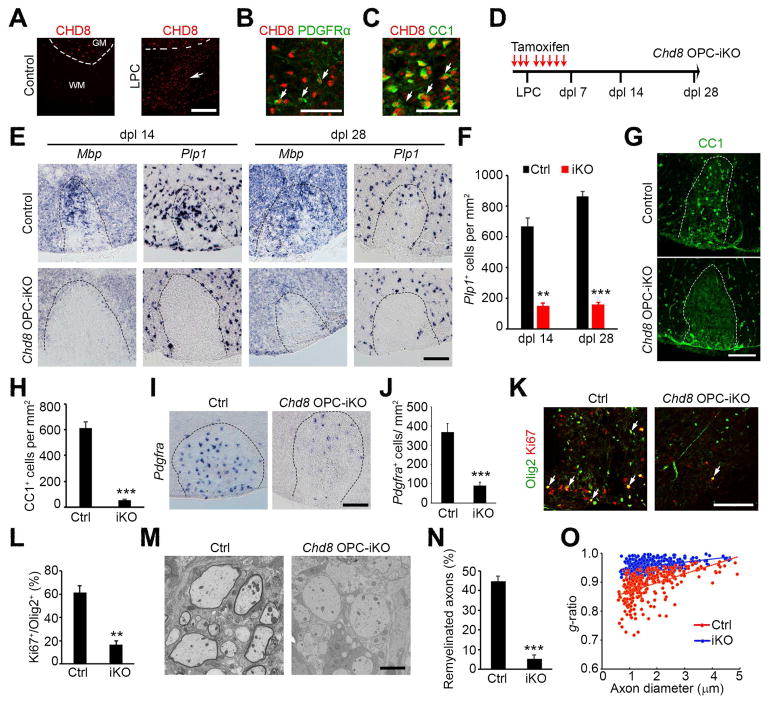
Figure 5. CHD8 is required for CNS remyelination.
(A) CHD8 and CC1 immunostaining in non-lesion control and LPC lesion spinal cords at dpl 7. Dashed line indicates the border between white (WM) and gray matter (GM). Scale bar, 200 μm.
(B, C) CHD8 and PDGFRα immunostaining (B) and CC1 (C) at LPC-lesion sites. Scale bar, 50 μm.
(D) Diagram showing TAM administration and LPC injection schedule.
(E) In situ hybridization for Pdgfra, Mbp, and Plp1 in spinal LPC lesions of control and Chd8 OPC-iKO mutants at dpl 14 and 28. Scale bar, 100 μm.
(F) Quantification of Plp1+ oligodendrocytes in LPC lesion sites at dpl 14 and 28. Data are presented as means ± s.e.m.
(G, H) Immunostaining for CC1 in LPC lesions from control and Chd8 OPC-iKO spinal cords at dpl 14. Scale bar, 100 μm. H, quantification of CC1+ oligodendrocytes in LPC lesion.
(I, J) In situ hybridization for Pdgfra in spinal LPC lesions of control and Chd8 OPC-iKO mutants at dpl 14. Scale bar, 100 μm. J, quantification of Pdgfra+ OPCs in LPC lesion sites
(K) Immunostaining for Ki67 and Olig2 in LPC lesions from control and Chd8 OPC-iKO spinal cords at dpl 14. Scale bar, 100 μm.
(L) Quantification of Ki67+ cells among total Olig2+ OPCs in LPC lesion sites at dpl 14.
(M) Electron microscopy of LPC lesions from control and Chd8 OPC-iKO spinal cords at dpl 14. Scale bar, 2 μm.
(N) The percentage of remyelinated axons in LPC-induced lesions of control and Chd8 OPC-iKO spinal cords at dpl 14.
(O) The myelin g-ratio in LPC-induced lesions of control and Chd8 OPC-iKO mutants at dpl 14 (n > 200 axons from 3 animals; p < 0.001, two-tailed unpaired Student’s t test).
* p < 0.01 and ** p < 0.001, two-tailed unpaired Student’s t test in F, H, J, L, N (n = 4 animals/genotype).
See also Figure S6.

