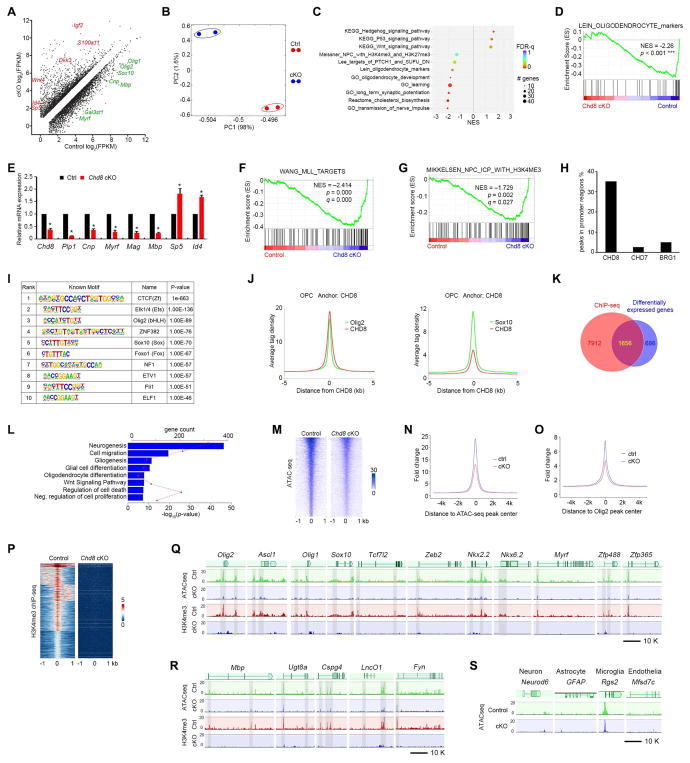
Figure 6. CHD8 controls the core regulatory network for oligodendrocyte differentiation.
(A) Differentially expressed transcripts (highlighted in color; FDR < 0.05) between OPCs isolated from control and Chd8 cKO mouse brains at P7.
(B) Principal components analysis (PCA) of RNA-seq data from control and Chd8 cKO OPCs.
(C) GSEA terms that are significantly different in the Chd8 cKO OPC cells compared to controls. NES: net enrichment score.
(D) GSEA plot shows oligodendrocyte signature genes are downregulated in the Chd8 cKO cells.
(E) qRT-PCR analysis of myelination-associated genes in control and Chd8 cKO OPCs. Data are presented as means ± s.e.m. (n = 3 experiments; * p < 0.05, two-tailed unpaired Student’s t test).
(F, G) GSEA plots show KMT2/MLL target genes (F) and H3K4me3 (G) targeted genes are downregulated in Chd8 cKO cells.
(H) Percentage of binding peaks of CHD8, CHD7, and BRG1 in the genome of OPCs.
(I) Enriched motifs in the CHD8-bound regions.
(J) The signal density of Olig2 and Sox10 peaks plotted relative to CHD8 peaks.
(K) Venn diagram showing the overlap between CHD8-bound genes and differentially expressed genes in control and Chd8 cKO OPCs. The overlapping genes are direct CHD8 target genes.
(L) Enrichment analysis of pathway terms overrepresented in CHD8 target genes.
(M) Heatmaps for ATAC-seq peaks from control and Chd8 cKO OPCs showing ± 1 kb around the ATAC-seq peak center.
(N, O) Tag enrichments of accessible genomic regions relative to ATAC-seq peaks (N) and Olig2 binding peaks (O) in control and Chd8 cKO OPCs.
(P) Heatmaps for H3K4me3 ChIP-seq peaks from control and Chd8 cKO OPCs showing ± 1 kb around the peak center.
(Q, R) Representative ATAC-seq and H3K4me3 ChIP-seq tracks of OPC specification regulatory genes (Q), myelination-related genes (R) in the control and Chd8 cKO OPCs.
(S) Representative ATAC-seq tracks of neuronal, astrocytic, microglial, and endothelial genes in the control and Chd8 cKO OPCs.
See also Figure S7.

