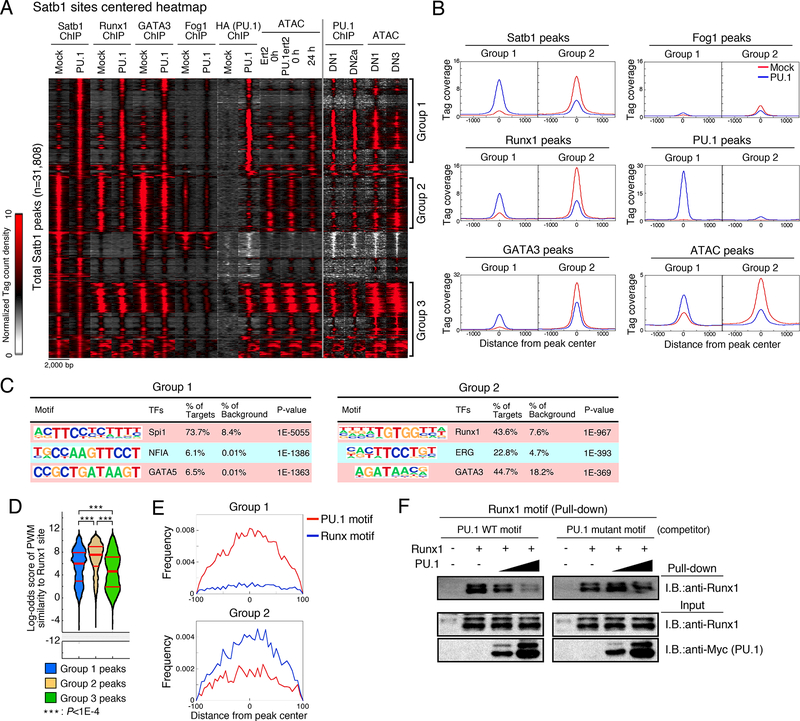
Figure 3. PU.1 redirects transcription factor ensembles.
(A), Peak group classification: tag count distributions for Satb1, Runx1, GATA3, Fog1 and PU.1 ChIP, and ATAC signal around Satb1 peaks using mock- or PU.1-introduced Scid.adh.2c2 cells are shown. PU.1 ChIP in primary DN1 and DN2a, and ATAC signal in DN1 and DN3 are also indicated.
(B), Average tag count distributions in Group 1 and Group 2.
(C), Top three enriched sequence motifs in Group 1 and Group 2.
(D), Distribution of motif log-odds similarity scores for Groups 1, 2, and 3 against position weight matrix (PWM) for Runx1 sites in DN1 and DN3 cells (Fig S1E). Median, 25% and 75% percentiles are also shown. P-values determined by Kruskal-Wallis statistical test.
(E), PU.1 and Runx motif distributions around Group 1 and 2 peaks. Data are based on reproducible ChIP and ATAC signals in two replicate samples for (A, B, C, D, E). Scid.adh.2c2 cells were transduced with Runxl and/or Myc-Flag-PU.1 as indicated, and nuclear lysates subjected to pulldown assay using biotinylated Runx1 motif oligonucleotides with or without competitor oligonucleotides containing a canonical or mutant PU.1 motif. Precipitated proteins were eluted by SDS sample buffer and subjected to IB. Representative of two independent experiments. See also Fig. S1, S2 and Table S2.

