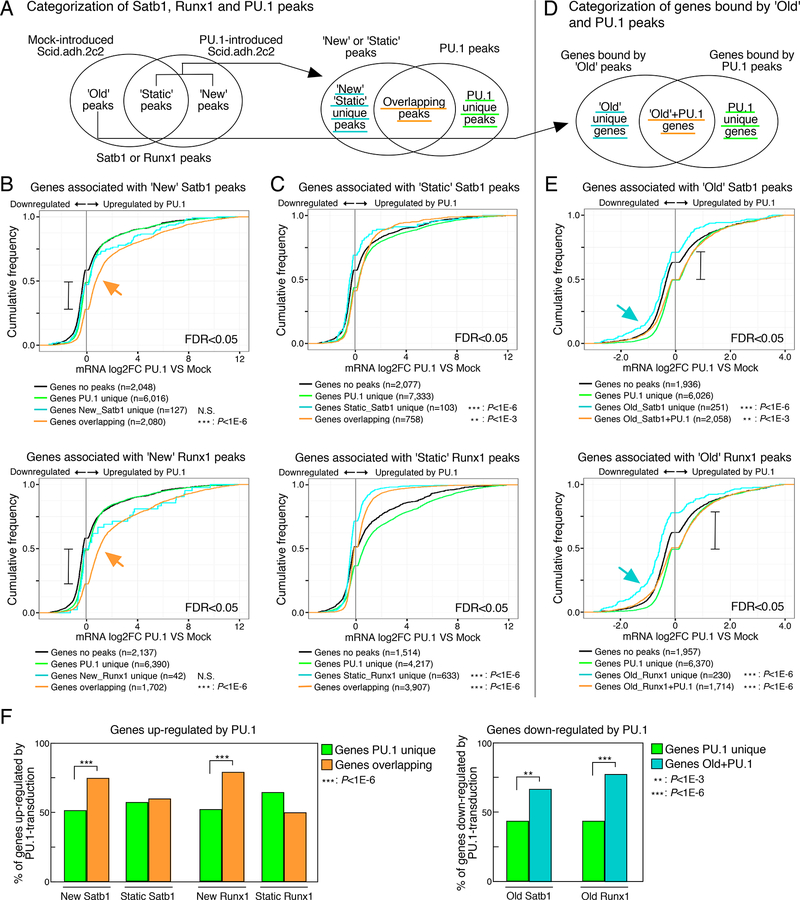
Figure 4. PU.1-mediated gene regulation is correlated with the redirection of Satb1 and Runx1.
(A), Categorization of Satb1, Runx1 and PU.1 peaks.
(B and C), Cumulative distributions of expression changes by PU.1 introduction for four groups of genes bound by ‘New’ (B) and ‘Static’ (C) peaks depicted in (A) and differentially expressed in PU.1-introduced Scid.adh.2c2 (FDR<0.05). Number of genes in each group and p-values (K-S tests relative to ‘Genes PU.1 unique’) are shown.
(D), Categorization of genes bound by ‘Old’ peaks only (‘Old unique’) and those with PU.1 peaks.
(E), Cumulative distributions for four groups of genes bound by ‘Old’ peaks depicted in (D) and differentially expressed in PU.1-introduced Scid.adh.2c2 (FDR<0.05).
(F), Summary, percentage of genes in each category up-regulated by PU.1-transduction (from B, C)(left), and down-regulated by PU.1 transduction (from E) (right). P-values are determined by Fisher’s exact test. Data are based on reproducible ChIP-seq peaks in two replicate samples and two replicates for RNA-seq results. See also Table S3.

