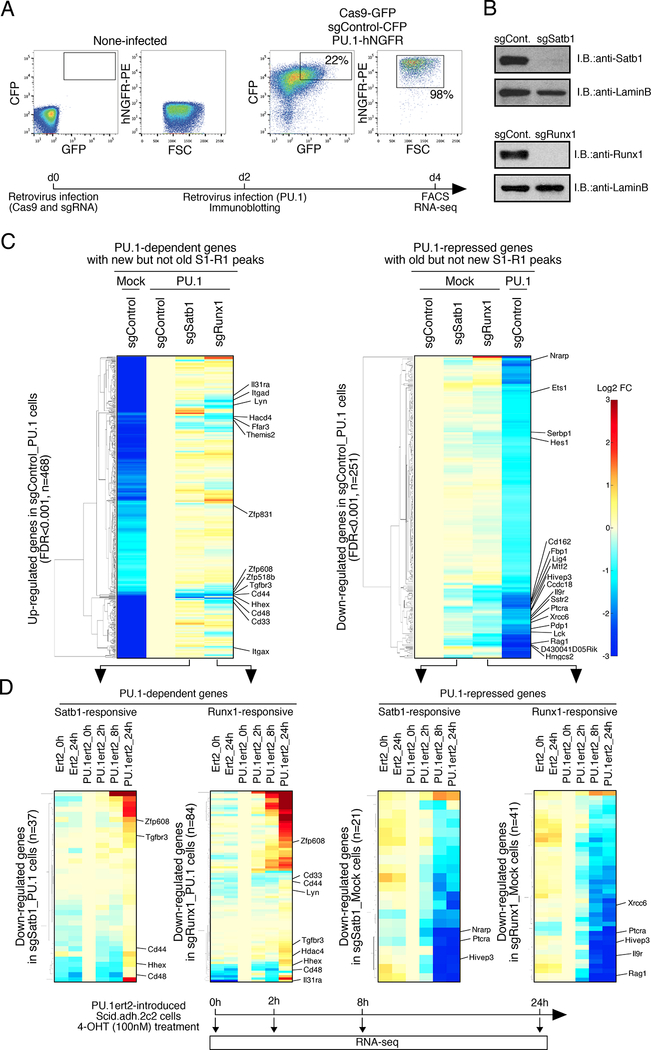
Figure 5. Satb1 and Runx1 play roles in PU.1-mediated gene regulation in Scid.adh.2c2 cells.
(A), For CRISPR-Cas9-mediated deletion of Satb1 and Runx1 in Scid.adh.2c2 cells, cells were infected with Cas9-GFP and sgRNA-CFP retroviruses. Two days after 1st infection, they had 2nd retrovirus infection for empty vector or PU.1-hNGFR. Flow cytometry analyses of transduced Scid.adh.2c2 cells shows sort gates. Experimental scheme is also indicated (lower)
(B), Protein levels of Satb1 and Runx1 in sgRNA transduced Scid.adh.2c2 cells are shown. Two days after retrovirus infection, nuclear lysates of the Cas9 and sgRNA transduced cells were prepared and subjected to IB with anti-Satb1, anti-Runx1 and anti-LaminB Abs.
(C), Gene expression profiles of PU.1-dependent and -repressed genes in Scid.adh.2c2 cells (see A) were determined by RNA-seq analysis. Genes differentially expressed in PU.1-introduced Scid.adh.2c2 cells (FDR<0.001) were hierarchically clustered by expression patterns. The ‘PU.1- dependent’ (up-regulated by PU.1) genes shown were also selected for binding by ‘new’ Satb1 or Runx1 peaks overlapping with PU.1 peaks, but not by ‘old’ Satb1 or Runx1 unique peaks. The ‘PU.1-repressed’ (down-regulated by PU.1) genes were also selected for binding by ‘old’ Satb1 or Runx1 unique peaks but not by any ‘new’ Satb1 or Runx1 peaks overlapping with PU.1.
(D), The time course of activation or repression of Satb1- and Runx1-responsive genes in response to 4-OHT-driven mobilization of PU.1ert2 is shown. Satb1- or Runx1-responsive (sgSatb1 or sgRunx1/sgControl<0.75) genes were selected from PU.1-dependent and PU.1-repressed gene sets in (C). Hierarchical clustering analyses show expression of these genes over 24 h response to PU.1ert2 or empty ert2 control as indicated (upper). Heat map color scale is as in (C). Experimental scheme is also indicated (lower). Three independent experiments were performed with similar results for (A, B). Results in (C, D) are from two replicate RNA-seq datasets. See also Fig. S3, S4, Table S3 and S4.

