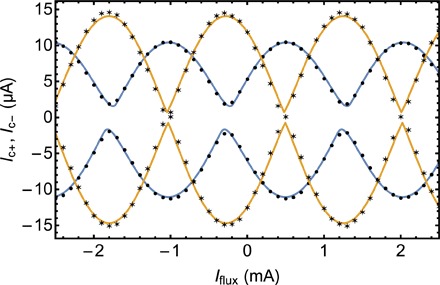
Fig. 3. High-resolution SQUID data and fits.

Plot of Ic+ and Ic− versus Iflux for SQUID 2A-4. The solid circles correspond to the initialized magnetic state, while the stars correspond to the second state after one junction has switched. The values of Ic+ and Ic− shown in this figure were obtained by fitting the IZ function to the raw I-V curves as shown in Fig. 2B. The solid lines (blue for the initial state and yellow for the second state) are least-squares fits to the data of standard SQUID theory [see (18) and Materials and Methods]. Values for the critical currents of the two Josephson junctions obtained from the fits are given in Table 1.
