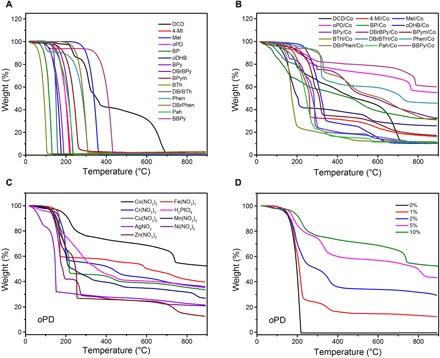
Fig. 2. TGA analyses.

(A) TGA curves of different SOMs (TMS-free) in N2 atmosphere. (B) TGA curves of different SOMs with Co(NO3)2 in N2 atmosphere. (C) TGA curves of oPD with different TMSs in N2 atmosphere. (D) TGA curves of oPD with different Co(NO3)2 contents in N2 atmosphere.
