. 2017 Dec 1;1(4):446–467. doi: 10.1162/NETN_a_00025

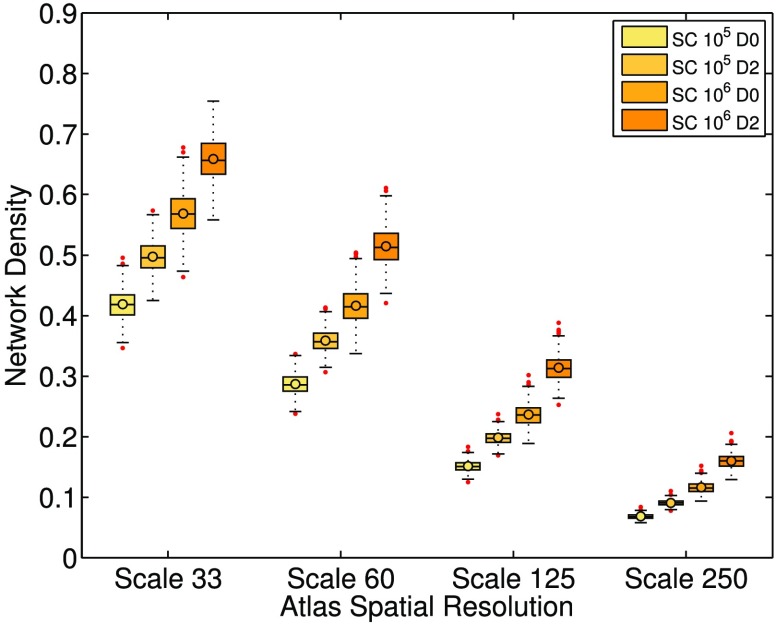
Figure 1. . Network density population distributions with varying atlas scales, dilation, and streamline count. The labels SC 105 and 106 denote datasets constructed under the tractography setting of a total streamline count of 105 or 106, respectively. The labels D0 and D2 denote datasets constructed without or with grey matter dilation, respectively. The upper and lower bounds of the boxes represent the 25th and 75th percentile of the distribution, and the line in the boxes represents the median, while the circle represents the average. The two horizontal lines below and above the box are marked by 1.5 times of the interquartile range outside of the first and third quartile, respectively. Data points outside of this range are deemed outliers and are marked as red points. The rest of the box plots in this study follow the same notations. Overall, networks with SC 106 and D2 have higher network density. This result is expected since both high streamline count and grey matter dilation introduce a higher probability of grey matter region pairs being connected by streamlines. In contrast, the density decreases with increasing atlas scales.

Figure 1.