. 2017 Dec 1;1(4):446–467. doi: 10.1162/NETN_a_00025

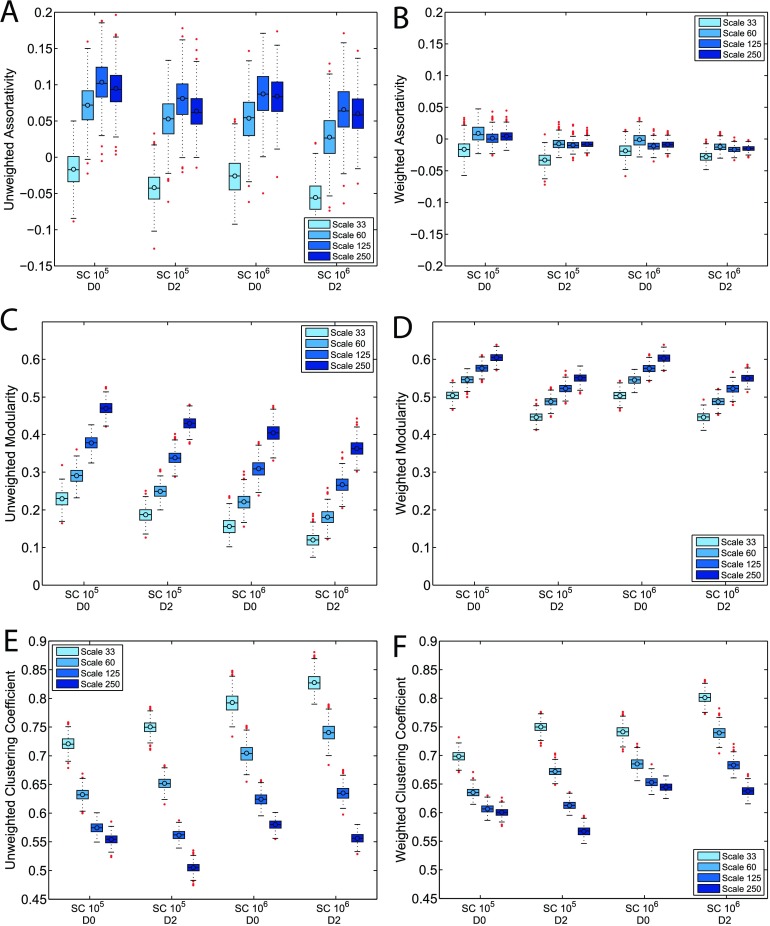
Figure 4. . Population distributions for unweighted and weighted graph metrics with varying atlas scales, streamline count, and dilation settings. The box-and-whisker plots are defined the same way as in Figure 1. Among assortativity, modularity, and clustering coefficient, assortativity shows the least variation across atlas scales. The majority of the networks produced at Scale 33 are weakly disassortative, while most of the networks produced in other atlas scales show low but positive assortativity. Networks produced at Scale 33 also consistently have weighted clustering coefficient values that are lower than the unweighted counterparts. These results highlight the difference in network topology at Scale 33. SC and dilation settings do not affect graph metrics as significantly as atlas scale. Detailed discussions of the effects of various tractography and network construction parameters on graph metrics are included in Results and Discussion.

Figure 4.