. 2017 Dec 1;1(4):446–467. doi: 10.1162/NETN_a_00025

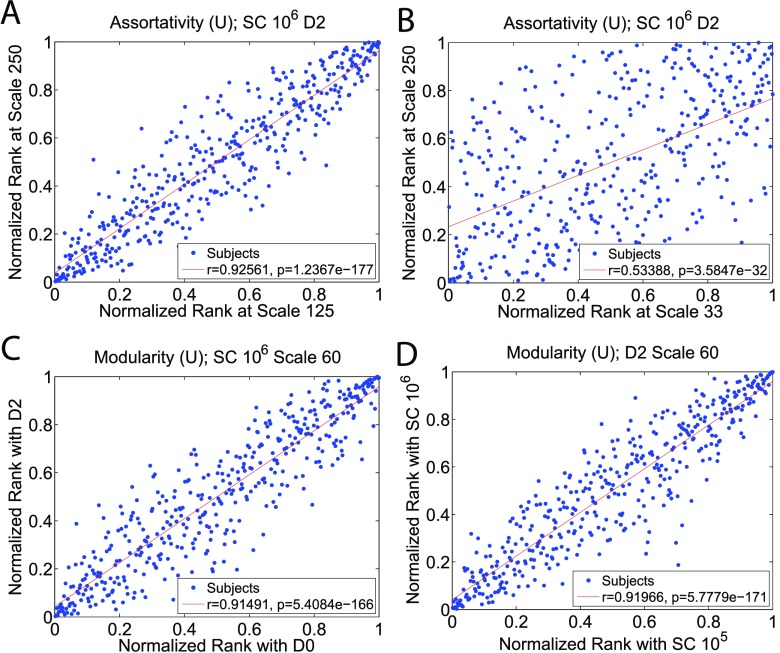
Figure 5. . Pearson correlation tests for the normalized ranks of each individual in unweighted graph metric population distributions under varying tractography and network construction settings. In these scatter plots, each data point represents an individual’s normalized network metric ranks among the population distributions produced under two contrasting parameter values. The correlation coefficient, r, is also included in each subplot, with higher r indicating that the rank of a subject is resilient against the particular parameter value change. Figure 5A illustrates that the normalized assortativity rank of a network will remain relatively consistent when the atlas scale is changed from Scale 125 to Scale 250. However, the normalized rank can change significantly when the scale change is large. For example, Figure 5B illustrates that the assortativity rank of a subject can vary significantly at Scale 33 and Scale 250. Table 3 summarizes the rank correlations among all four atlas scales for the three graph metrics. Figure 5C and Figure 5D illustrate that grey matter dilation and streamline count have a weak effect on changing the graph metric rank of a network.

Figure 5.