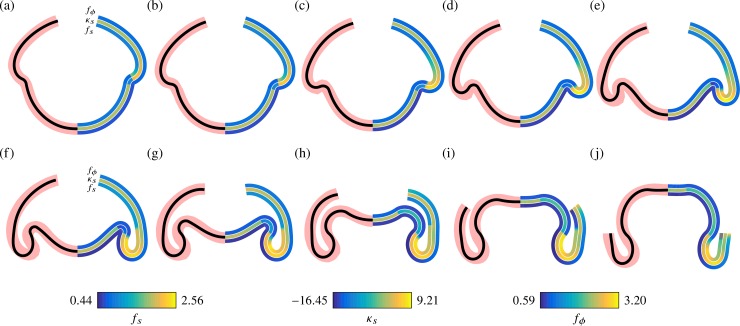
Fig 7. Average embryo shapes reproduced by the elastic model.
In each panel, the left half shows average shapes from Fig 4 (thick red line) and corresponding fits (black line) from the elastic model for different stages of inversion. The right half shows colour-coded representations of the meridional curvature κs and stretches fs (meridional) and fϕ (circumferential) in the fitted shapes. See S1 Data for numerical values.

