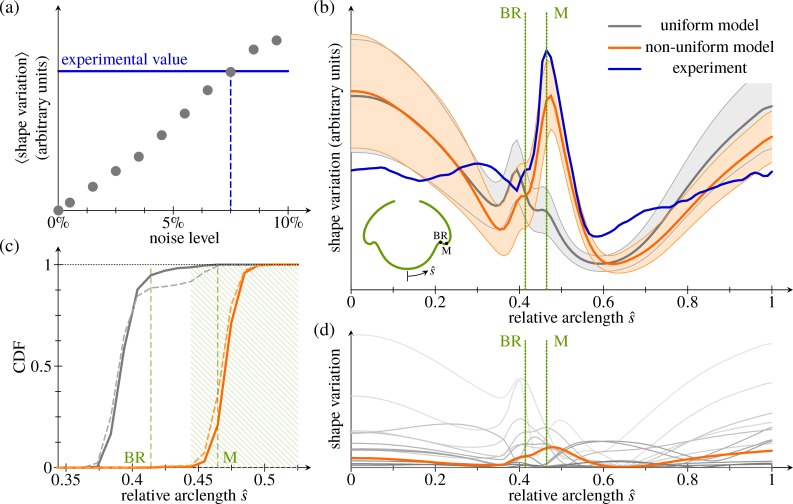
Fig 11. Analysis of shape variations.
(a) Mean shape variation (in arbitrary units) against magnitude of uniform perturbations to the fitted shape of the stage in Fig 4C. Each data point was obtained from 1,000 perturbations of the fitted shape. Horizontal line: mean shape variation obtained from the experimental data. (b) Magnitude of shape variations against (deformed) arclength. Thick blue line: experimental average from N = 22 embryo halves. Grey line and grey shaded area: average and standard deviation of 1,000 samples of N = 22 perturbations each under the uniform model. Orange line and orange shaded area: corresponding plot with increased variability in the anterior fold. Inset: average shape of Fig 4C, with BR and position of the maximum (labelled ‘M’) of the experimental shape variation marked; these positions are marked by dotted lines in the main diagram. (c) CDF of the positions of the peak (local maximum) of shape variation under the uniform (grey lines) and modified (orange lines) models, with positions of the BR and of the maximum (labelled ‘M’) of the experimental distribution from panel b labelled. Dashed lines show distributions from all random perturbations; solid lines show those from shape variations with a single local maximum. A maximum is considered to lie in the anterior fold if it falls within the hatched region, which is used for the statistical estimates in the Materials and methods section. (d) Magnitude of shape variations induced by varying individual parameters (grey lines); each line is average of 250 samples of N = 22 perturbations each. Only increased variability of the stretching in the anterior fold (orange line) produces a single narrow peak of variability close to the experimental maximum. See S1 Data for numerical values. BR, bend region; CDF, cumulative distribution function.

