. 2018 Jun 14;7:e33854. doi: 10.7554/eLife.33854

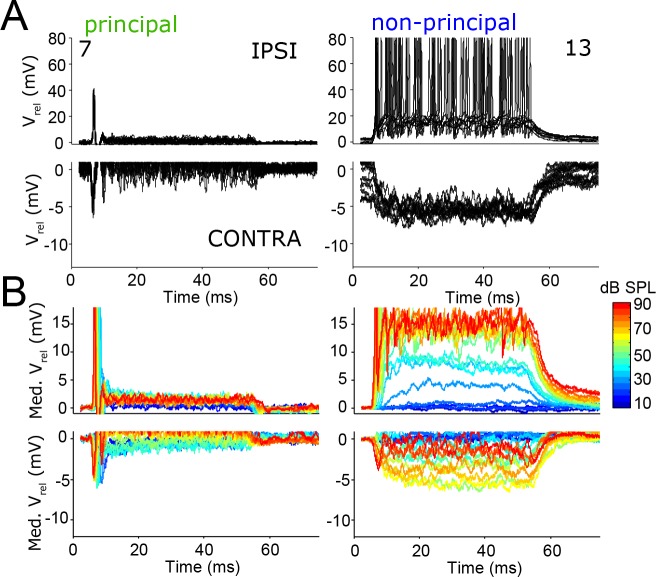
Figure 7. The temporal pattern of inhibition matches that of excitation.

(A) Repetitions of evoked responses to monaural ipsilateral (top panels) or contralateral (bottom panels) tones at CF or BF at 70 dB SPL, for two example neurons (numbers refer to Supplementary file 1). (B) Median Vm to ipsilateral and contralateral tones at CF or BF at different sound intensities, for the same neurons as in A. Respective stimulus frequencies and number of repetitions: 5.6 kHz, N = 20 (left column); 11 kHz, N = 10 (right column).

Figure 7.

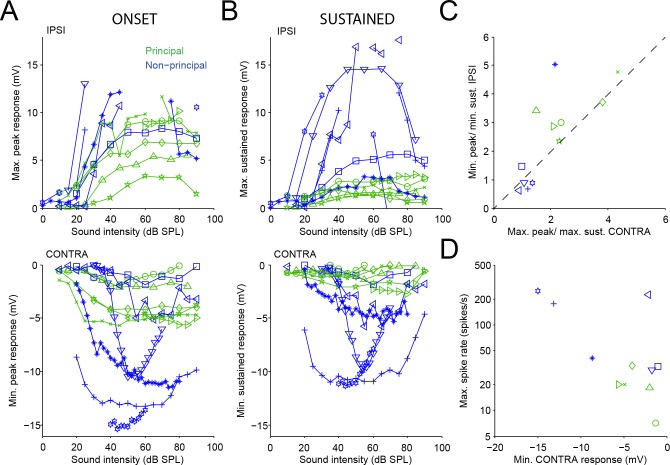
Figure 7—figure supplement 1. Sound-evoked excitation and inhibition is balanced.

Figure 7—figure supplement 1.

(A) Top panel: Maximal depolarization during onset (5–15 ms post stimulus onset) for averaged responses to ipsilateral tones, as a function of sound level. Spikes occurring in or bordering intervals defined as onset (5–15 ms post stimulus onset) or sustained (40–50 ms post stimulus onset) were not included in the averages. Bottom panel: Maximal hyperpolarization during onset for averaged responses to contralateral tones, as a function of sound level. Data shown for 12 neurons. (B) Similar to A, for the sustained part of averaged subthreshold responses (40–50 ms post stimulus onset; for two neurons, 25 ms tones were used and the sustained part is calculated from 20 to 25 ms post stimulus onset). (C) Ratio of peak vs. sustained depolarization during ipsilateral tones as a function of the ratio of peak vs. sustained hyperpolarization during contralateral tones, for the same data as in A/B. Diagonal line indicates identity. (D) Maximal spike rate during ipsilateral tones versus the largest hyperpolarization during contralateral tones, for 11 neurons. Different symbols indicate different cells, where the same symbol corresponds to the same cell in each panel.
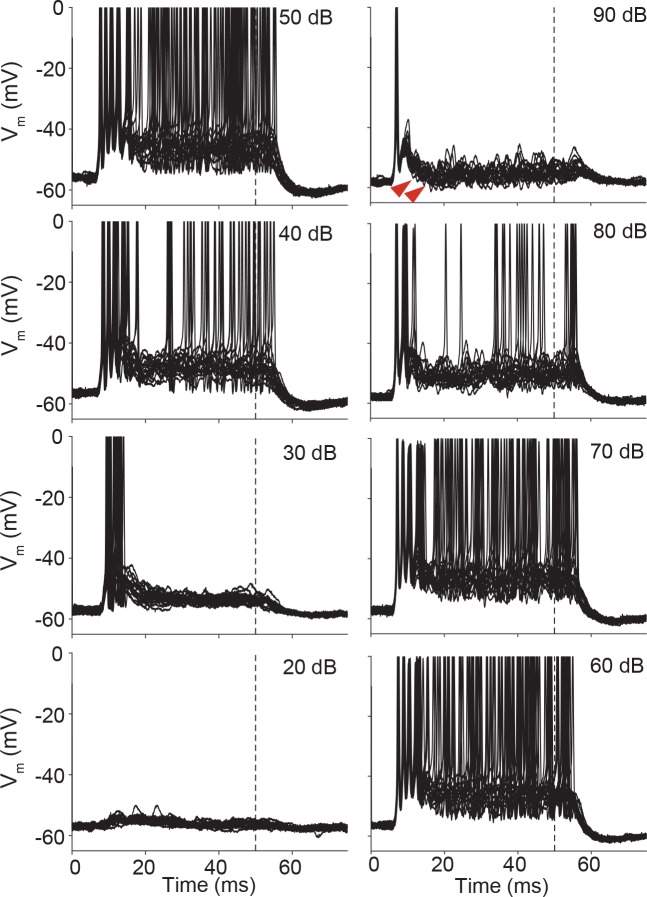
Figure 7—figure supplement 2. Stacked responses of a non-principal LSO cell to ipsilateral tones at CF (5.7 kHz).

Figure 7—figure supplement 2.

At high sound intensities, IPSPs (most pronounced at 90 dB: examples indicated by red arrowheads) are evoked in addition to EPSPs and action potentials. Action potentials are clipped at 0 mV.
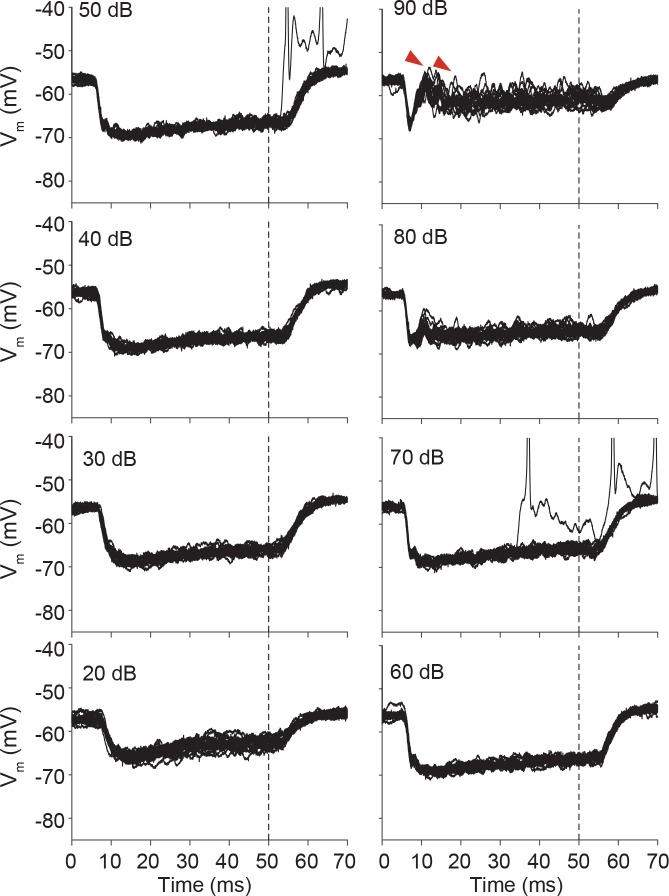
Figure 7—figure supplement 3. Stacked responses of the same cell as in Figure 7—figure supplement 2 to contralateral tones at CF (5.7 kHz).

Figure 7—figure supplement 3.

At high sound intensities, EPSPs (most pronounced at 90 dB: examples indicated by red arrowheads) are evoked in addition to IPSPs.