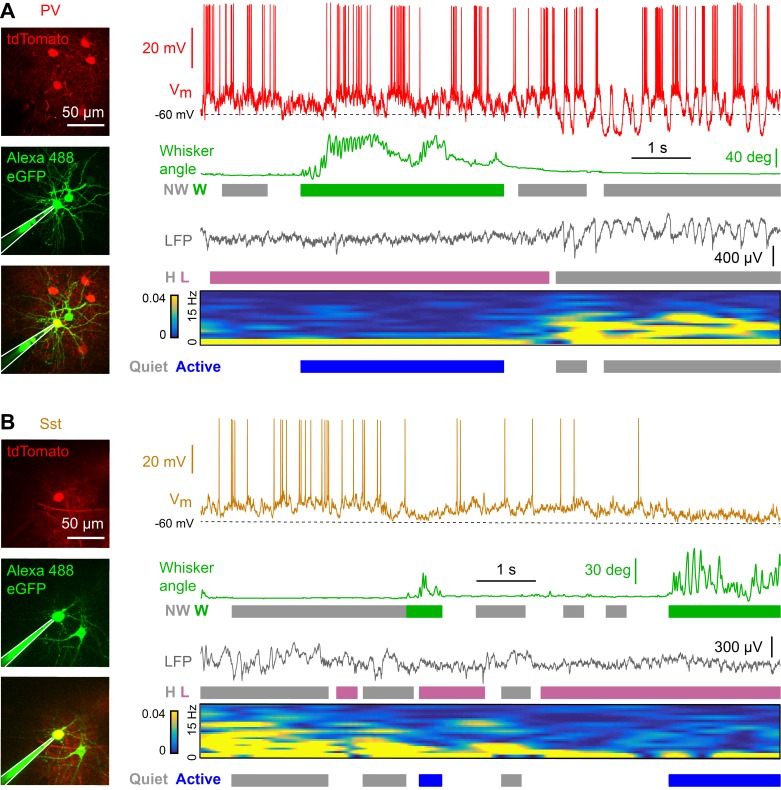
Figure 1. Membrane potential recordings of PV- and Sst-expressing GABAergic neurons in layer 2/3 of the awake mouse barrel cortex with simultaneous measurement of whisker position and local field potential.
(A) Example recording of a PV-expressing neuron. From top to bottom: Membrane potential (Vm), whisker angle, local field potential (LFP), normalized LFP FFT power. Green/grey boxes represent Whisking/Not-Whisking states, pink/grey color boxes represent Low/High 1–5 Hz LFP power states, and blue/grey boxes represent Active/Quiet states. (B) Same as in panel A, but for a Sst-expressing neuron.

