. 2018 Jul 27;7:e35869. doi: 10.7554/eLife.35869

Figure 2. State-dependent modulation of membrane potential dynamics in PV and Sst neurons.

(A) Mean membrane potential (Vm). (B) Standard deviation (SD) of Vm. (C) Spontaneous action potential (AP) rate. (D) Vm FFT amplitude spectrum. (E) Vm FFT amplitude in the 1–5 Hz frequency band. (F) Peak cross-correlation between Vm and LFP. Two-tailed Wilcoxon signed-rank test assessed statistical significance, with ** indicating p<0.01 and * indicating p<0.05.

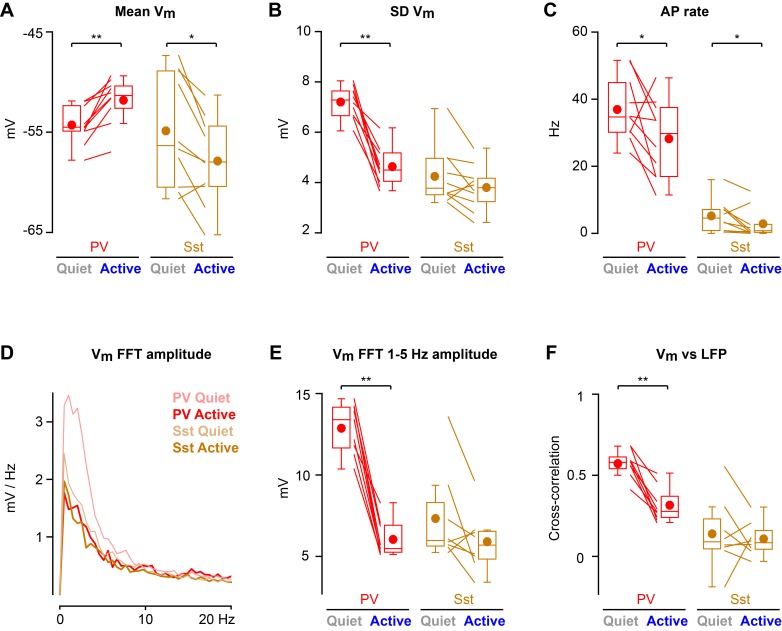
Figure 2—source data 1. Data values and statistics underlying Figure 2.
DOI: 10.7554/eLife.35869.007

Figure 2.

Figure 2—figure supplement 1. LFP dynamics and whisking behavior are similar in PV-Cre x LSL-tdTomato and Sst-Cre x LSL-tdTomato.

Figure 2—figure supplement 1.

(A) LFP FFT amplitude spectrum. (B) LFP FFT amplitude in the 1–5 Hz and 1–80 Hz frequency bands. (C) Fraction of time spent in Not-Whisking and Whisking states. (D) Mean duration of Not-Whisking and Whisking epochs. Two-tailed Wilcoxon rank-sum test assessed for statistical significance and none was found.
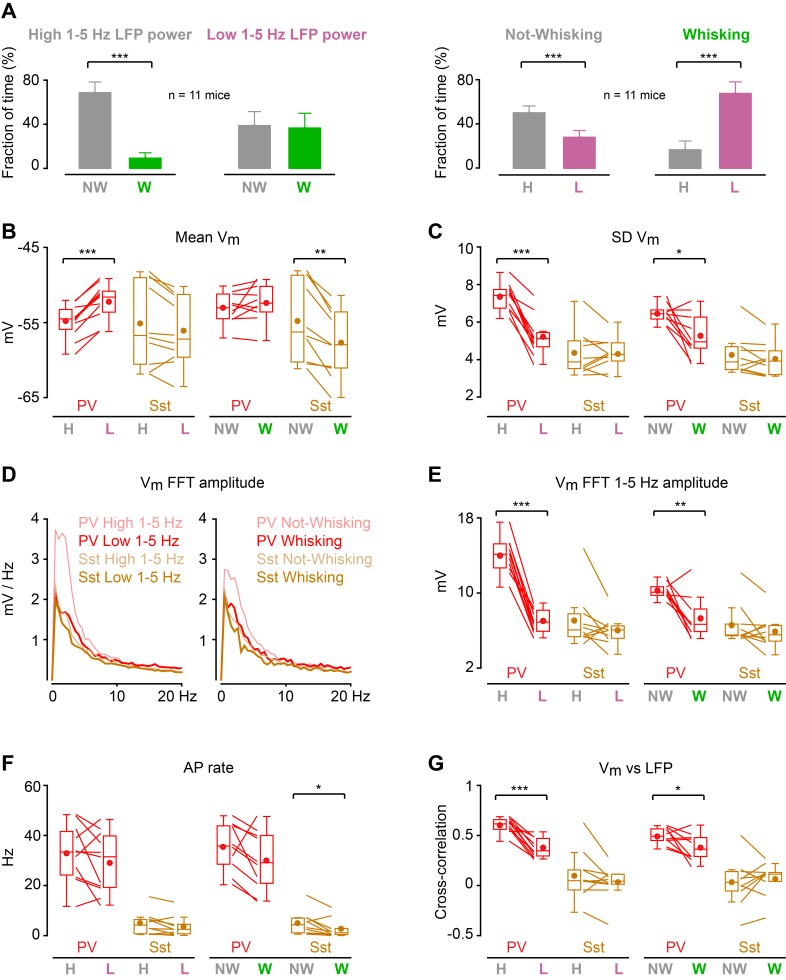
Figure 2—figure supplement 2. Differential modulation of membrane potential dynamics in PV and Sst neurons by cortical state and whisking behavior.

Figure 2—figure supplement 2.

(A) Fraction of time spent in Low 1–5 Hz LFP power (L), High 1–5 Hz LFP power (H), Whisking (W) and Not-Whisking (NW) states. (B) Mean membrane potential (Vm). (C) Standard deviation (SD) of Vm. (D) Vm FFT amplitude spectrum. (E) Vm FFT amplitude in the 1–5 Hz frequency band. (F) Spontaneous AP rate. (G) Peak cross-correlation between Vm and LFP. H: High 1–5 Hz LFP power, L: Low 1–5 Hz LFP power, NW: Not-Whisking, W: Whisking. Two-tailed Wilcoxon signed-rank test assessed statistical significance, with *** indicating p<0.001, ** indicating p<0.01 and * indicating p<0.05.
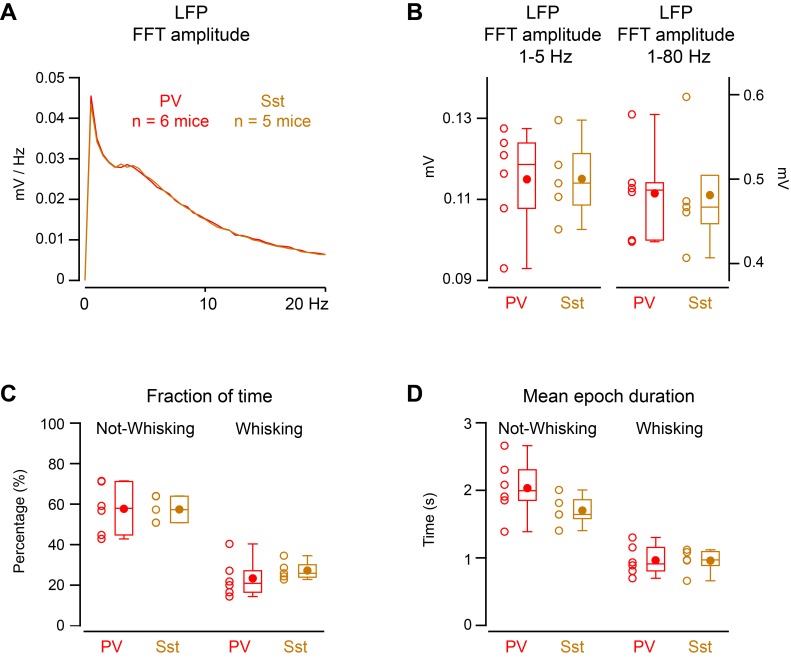
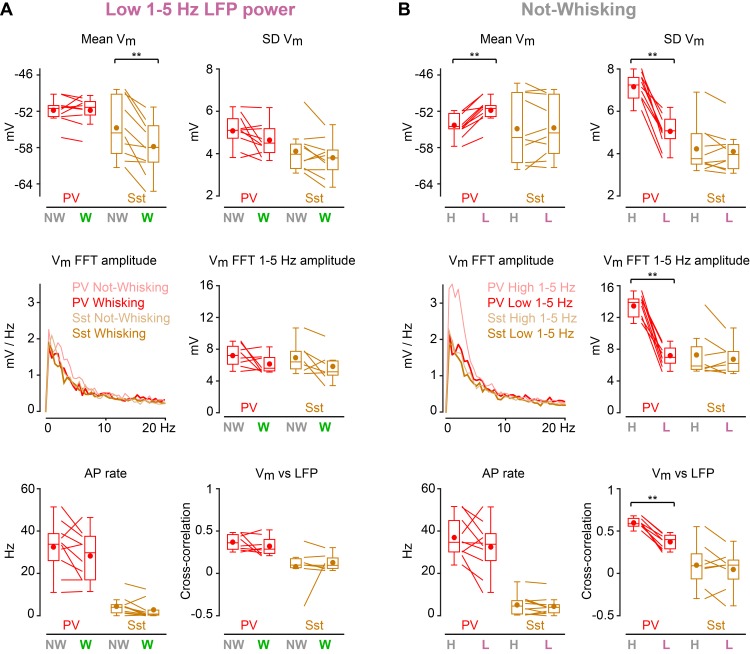
Figure 2—figure supplement 3. Membrane potential dynamics of PV neurons apear to be more strongly modulated by cortical state, whereas Sst neurons appear to be more strongly modulated by whisking behavior.

Figure 2—figure supplement 3.

(A) Mean Vm; Standard deviation (SD) of Vm; Vm FFT amplitude spectrum; Vm FFT amplitude in the 1–5 Hz frequency band; Spontaneous AP rate; and Peak cross-correlation between Vm and LFP. Comparison between Not-Whisking and Whisking epochs occurring during Low 1–5 Hz LFP power. (B) Same as panel A, but comparing epochs of High and Low 1–5 Hz LFP power occurring during Not-Whisking periods. NW: Not-Whisking, W: Whisking, H: High 1–5 Hz LFP power, L: Low 1–5 Hz LFP power. Two-tailed Wilcoxon signed-rank test assessed statistical significance, with ** indicating p<0.01.