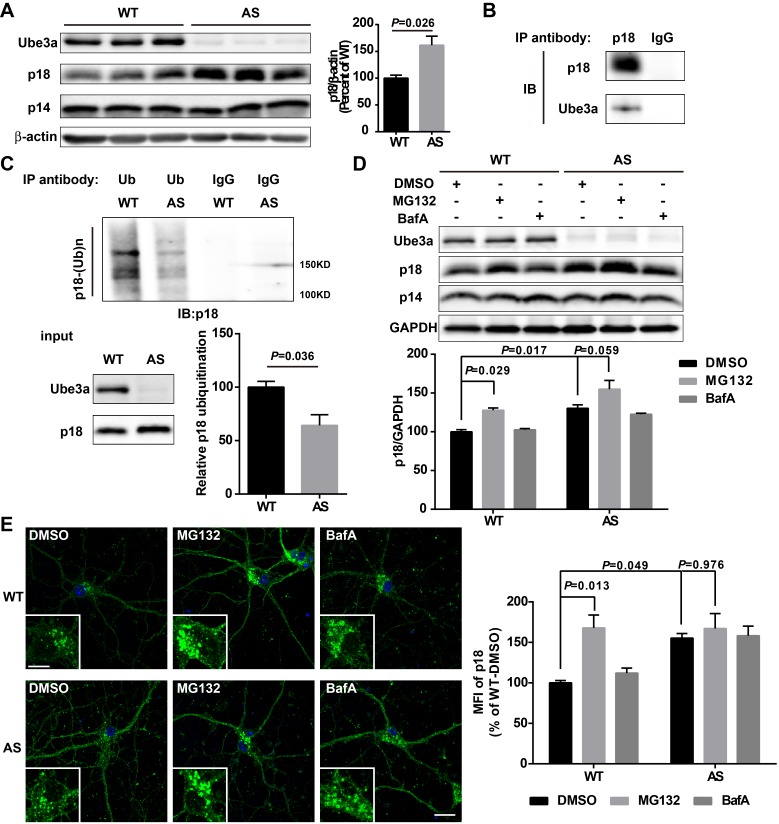
Figure 3. Ube3a regulates p18 levels in a proteasome-dependent manner in hippocampal neurons.
(A) Left, Western blot analysis of p18 and p14 levels in crude membrane fractions (P2) of hippocampi from WT and AS mice. Right, quantitative analysis of blots. Results are expressed as % of values in WT mice and shown as means ± SEM N = 3 mice, p=0.026 (unpaired, two-tailed Student's t-test). (B) Interactions between Ube3a and p18 in hippocampal neuron cultures. Western blot analysis with anti-p18 and -Ube3a antibodies of immunoprecipitation performed with anti-p18 antibodies or control IgG. (C) Immunoprecipitation of hippocampal P2 fractions from WT and AS mice under denaturing conditions was performed with anti-ubiquitin antibodies or control IgG, and Western blots were labelled with anti-p18 antibodies. Ubiquitinated p18 proteins are indicated as ‘p18-(Ub)n’. Lower left panel: levels of input proteins were evaluated by Western blots probed with Ube3a and p18 antibodies. Lower right panel: quantification of the relative abundance of ubiquitinated p18 in hippocampus of WT and AS mice (mean ± SEM, p=0.036 compared with WT mice, n = 3 mice, Student’s t-test). (D) Effects of acute MG132 or bafilomycin A1 (BafA) treatment on p18 and p14 levels in hippocampus slices of WT and AS mice. Upper panel: representative Western blot images; lower panel: quantitative analysis of blots in upper panel. N = 3 independent experiments, p=0.029 WT/DMSO vs. WT/MG132, p=0.017 WT/DMSO vs. AS/DMSO, p=0.059 AS/DMSO vs. AS/MG132, two-way ANOVA with Tukey’s post-test. (E) Representative images of p18 in WT and AS hippocampal neurons treated with DMSO, MG132, and BafA; insets: enlarged cell bodies. Right: Quantitative analysis of images. Data are expressed as mean ± SEM. N = 3 independent experiments, p=0.013 WT/DMSO vs. WT/MG132, p=0.049 WT/DMSO vs. AS/DMSO, p=0.976 AS/DMSO vs. AS/MG132; two-way ANOVA with Tukey’s post hoc analysis. Scale bar = 20 and 10 µm in insets. See also Figure 3—figure supplement 1 and Figure 3—source data 1.


