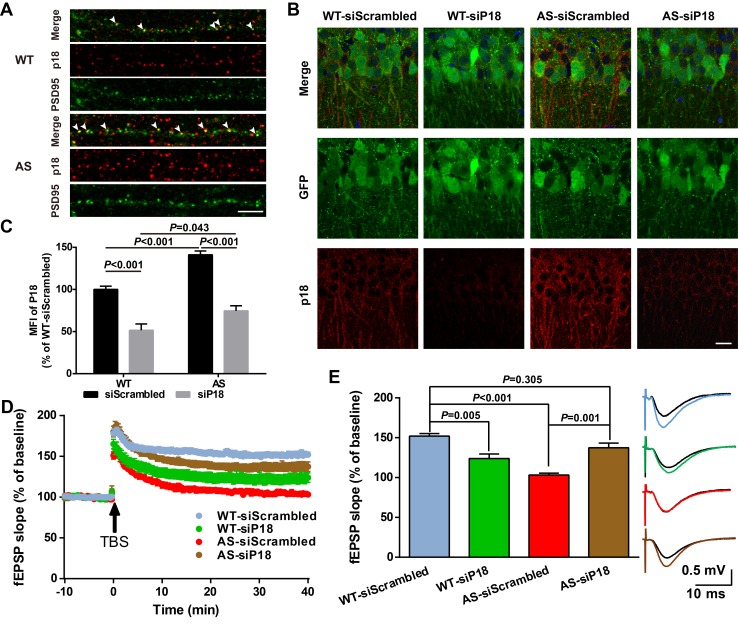
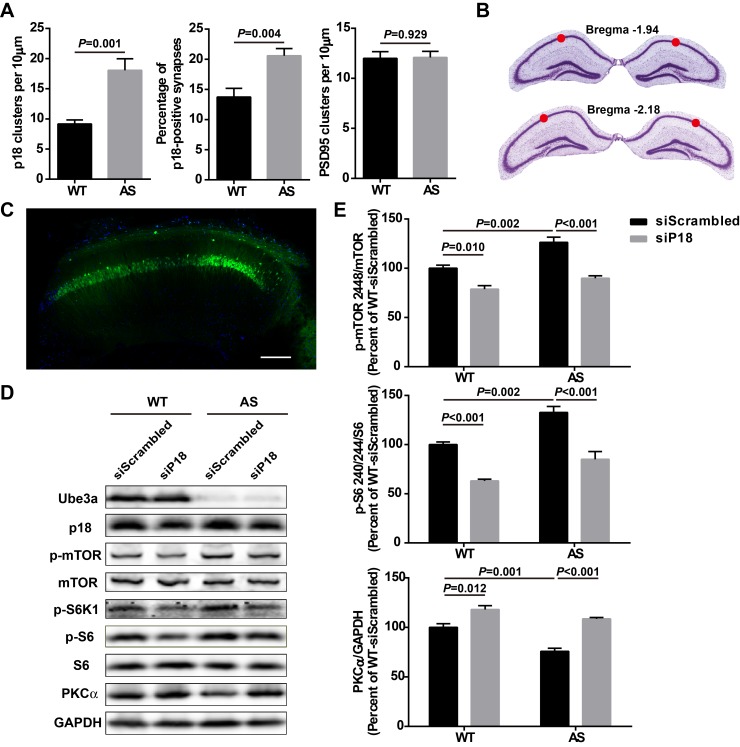
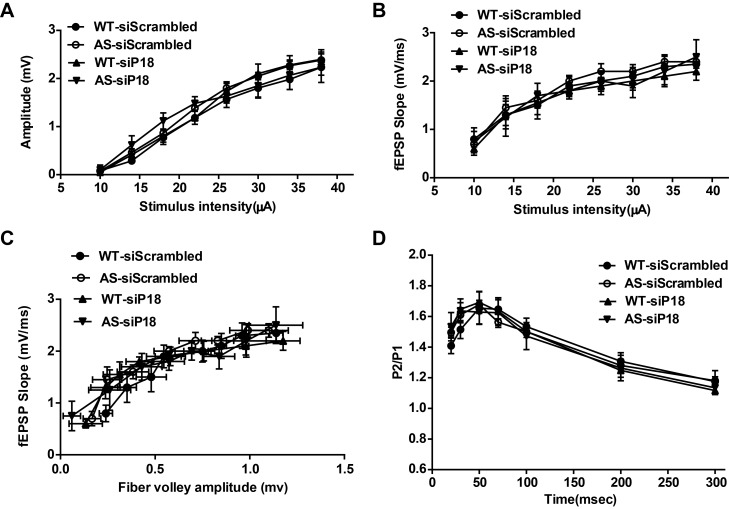
Figure 6. Effects of p18 KD in hippocampal CA1 region on LTP in WT and AS mice.
(A) Representative images of dendrites of CA1 pyramidal neurons stained with anti-p18 (red) and -PSD95 (green) antibodies. Arrowheads indicate co-localized puncta. Scale bar = 10 µm. (B) Representative images of CA1 pyramidal neurons stained with anti-p18 (red) and -GFP (green) antibodies. Scale bar = 20 µm. (C) Quantitative analysis of the mean fluorescence intensity (MFI) of p18-immunoreactive puncta in GFP-positive CA1 pyramidal neurons. N = 6 mice, p<0.001, WT-siScrambled vs. WT-siP18; p<0.001, WT-siScrambled vs. AS-siScrambled; p<0.001, AS-siScrambled vs. AS-siP18; p=0.043, WT-siP18 vs. AS-siP18, two-way ANOVA with Tukey’s post-test. (D, E) Effects of AAV siRNA-mediated p18 KD on LTP in WT and AS mice. (D) Slopes of fEPSPs were normalized to the average values recorded during the 10 min baseline. (E) Means ± SEM of fEPSPs measured 40 min after TBS in different groups. N = 7–14 slices from four to eight mice, p=0.005, WT-siScrambled vs. WT-siP18, p<0.001, WT-siScrambled vs. AS-siScrambled, p=0.001, AS-siScrambled vs. AS-siP18, p=0.305, WT- siScrambled vs. AS-siP18, two-way ANOVA with Tukey’s post-test. Inset shows representative traces of evoked fEPSPs before and 40 min after TBS. Scale bar 0.5 mV/10 ms. See also Figure 6—figure supplements 1 and 2 and Figure 6—source data 1.


