
Figure 1.
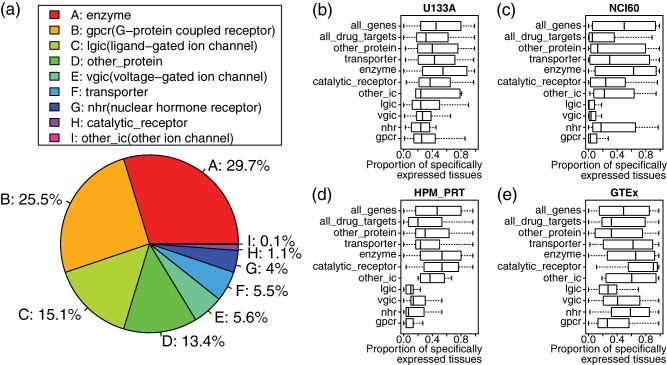
Tissue‐specificity of distinct target classes in four datasets. (a) Pie chart showing the proportion of 8 protein classes among all 5,016 drug ∼ target proteins pairs from DrugBank. (b–e) Boxplot showing the tissue‐specificity of distinct target classes in four datasets. The tissue‐specificity of a target protein is defined as the proportion of tissues in which the target is highly expressed when compared to the median of all the genes. To account for the variation in the absolute expression of different genes, the expression of each gene is normalized by the baseline level. Each box on the Y‐axis represents one target class. The X‐axis shows the tissue‐specificity of proteins belonging to the target class. “All_drug_targets” represents the combination of all the target classes. “All_genes” represents all the genes in the human genome.