
Figure 5.
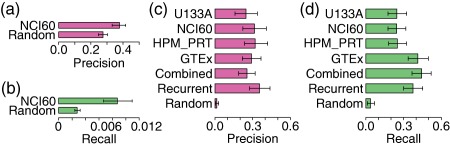
Validation of drug‐pathway‐tissue connections built by Drugs to target pAthways by the Tissue Expression (DATE). (a,b) Validation of drug‐pathway‐tissue connections (NCI60) using a reference standard created from L1000 drug‐induced expression data. A positive standard of drug‐pathway‐tissue connection was defined as a significant change in pathway expression after drug treatment in the tissue. The Bar plot shows the average precision a and recall b of validated drugs. Precision = TP/(TP+FP), Recall = TP/(TP+FN). “Random” represents null distribution generated by randomly assigning pathway‐tissue to each drug. The error bar indicates 95% confidence interval of average calculated by bootstrap. (c,d) Validation of drug‐pathway connections using a reference standard from Pharmacogenomics Knowledgebase (PharmGKB), which provides mapping between drugs and pharmacodynamic and pharmacokinetic pathways. The barplot shows the average precision c and recall d of validated drugs. “Combined” represents all drug‐pathway connections from four datasets. “Recurrent” represents drug‐pathway connections that appear in at least two datasets. “Random” represents null distribution generated by randomly assigning pathway‐tissue to each drug. The error bar indicates 95% confidence interval of average calculated by bootstrap.