
Figure 6.
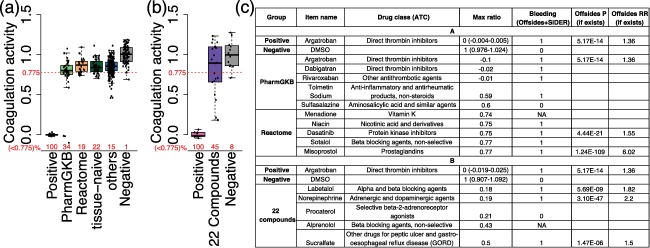
Experimental validation of drugs predicted with anticoagulation activity. (a) Boxplot with jitter showing the coagulation activity of 6 groups: (1) positive control: argatroban; (2) Reactome: 26 predicted drugs connected to Reactome pathways; (3) Pharmacogenomics Knowledgebase (PharmGKB): 41 predicted drugs connected to PharmGKB pathways; (4) tissue‐naïve: 50 drugs that can be predicted by tissue‐naïve methods, but not DATE; (5) others: the other unpredicted 325 drugs; and (6) Negative control: DMSO. The Y‐axis shows the coagulation activity of drugs represented by “maximum ratio” score. A red dashed line was drawn at 0.775 on Y‐axis, representing the threshold of significant anticoagulation activity. The proportion of compounds with significant anticoagulation activity (maximum ratio <0.775) in each group was shown in red numbers on X‐axis. (b) Boxplot with jitter showing the coagulation activity of three groups: (1) positive control: argatroban; (2) 22 newly predicted compounds that have not been screened on the coagulation activity in a; and (3) negative control: DMSO. (c) A table of predicted drugs with significant anticoagulation activity in a and b. Only the top five drugs in each group (PharmGKB, Reactome, and 22 compounds) were shown here. Full results can be found in Supplementary Table S10. P, P value; RR, reporting ratio; NA, compound was not studied in SIDER or OFFSIDES. Because only OFFSIDES provides a P value for each pair of drug and side effect, whereas SIDER only provides the mapping between them, some compounds will have blank profiles in the last two column if they were only reported in SIDER.