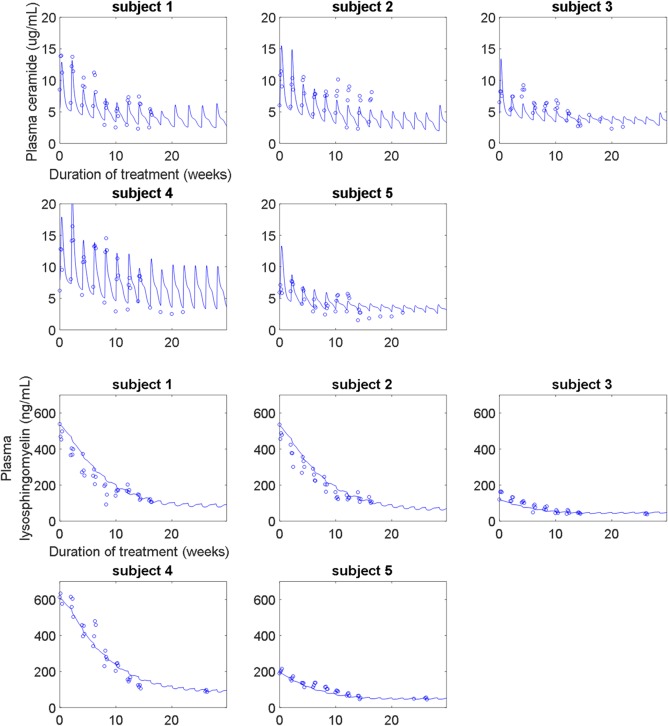
Figure 2.

(upper panel) Calibration of the molecular‐level submodel to plasma ceramide clinical data from the phase Ib study. The model describes both the short‐term and long‐term trends in plasma ceramide (normal range: 1.8–6.5 μg/mL) over time and across increasing doses (0.1–3 mg/kg). (lower panel) Calibration of the molecular‐level submodel to plasma lysosphingomyelin clinical data from the phase Ib study. The model describes the long‐term improvement in plasma lysosphingomyelin (normal range: <10 ng/mL) due to olipudase alfa treatment.
