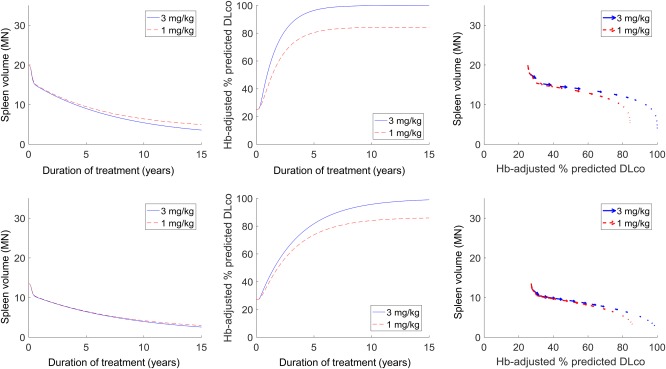
Figure 4.

Predicted differential responses in the spleen and lung for alternative olipudase alfa maintenance doses (3 mg/kg in solid blue vs. 1 mg/kg in dashed red) for virtual patients with varying disease severities at onset. The left and center columns show the temporal predictions of treatment response over 15 years of treatment, whereas the right column shows the response trajectory representations.
