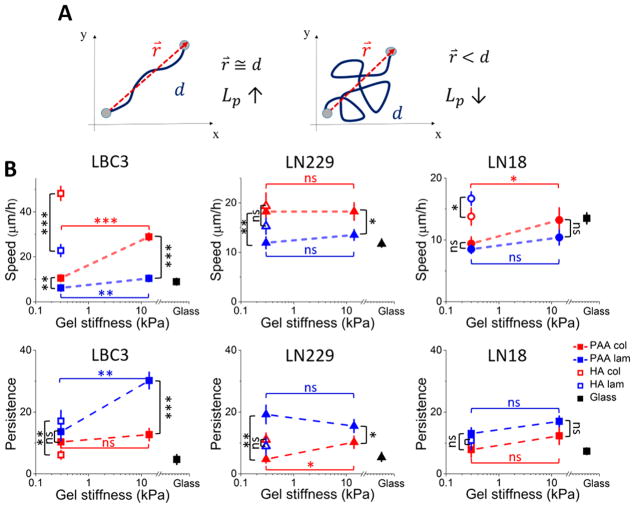
Figure 4.
Changes in cell motility as a response to substrate stiffness and composition. (A) Illustration of persistence of two different cell trajectories. (B) LBC3, LN229, and LN18 cell speed and persistence calculated based on time-lapse microscopy. Mean values ± standard deviations (SD) are presented and N ≥ 40 cells analyzed for each condition. Statistical differences were confirmed using the unpaired Student’s t test (denotations: *, P ≤ 0.05; **, P ≤ 0.01; ***, P ≤ 0.001; ns, P > 0.05). Black vertical lines indicate statistical significance between PAA and HA samples of the same stiffness but with different ligand (collagen I or laminin), while horizontal red and blue lines indicate statistical significance between 0.3 and 14 kPa PAA samples with the same adhesive ligand used for coating.

