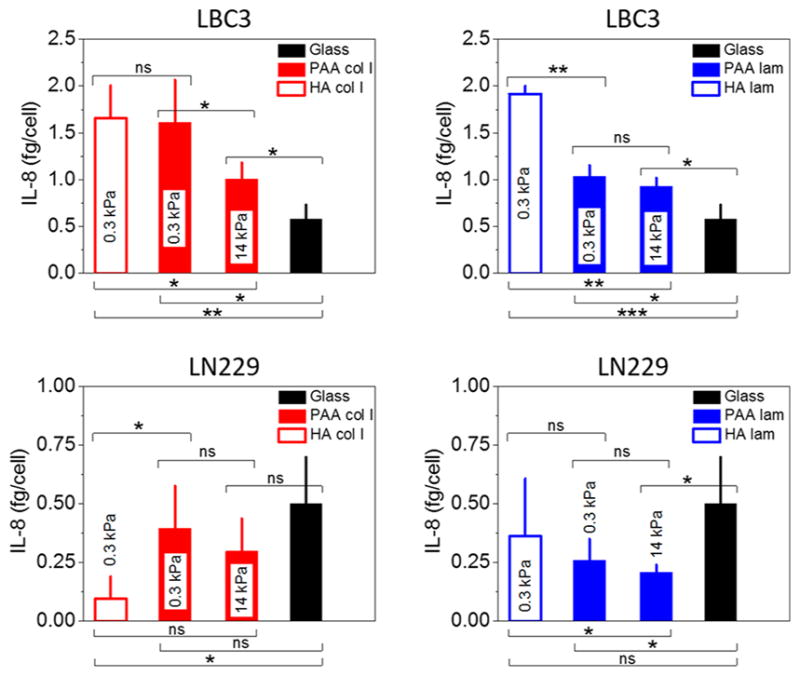
Figure 6.

IL-8 secretion by LBC3 and LN229 cells. Black columns indicate IL-8 release from cells grown on a glass surface, whereas blue and red columns indicate IL-8 release from cells grown on gels with 0.1 mg/mL laminin or collagen I, respectively. Mean values ± standard deviations (SD) are presented. The unpaired Student’s t test was used to confirm statistical differences (denotations: *, P ≤ 0.05; **, P ≤ 0.01; ***, P ≤ 0.001; ns, P > 0.05).
