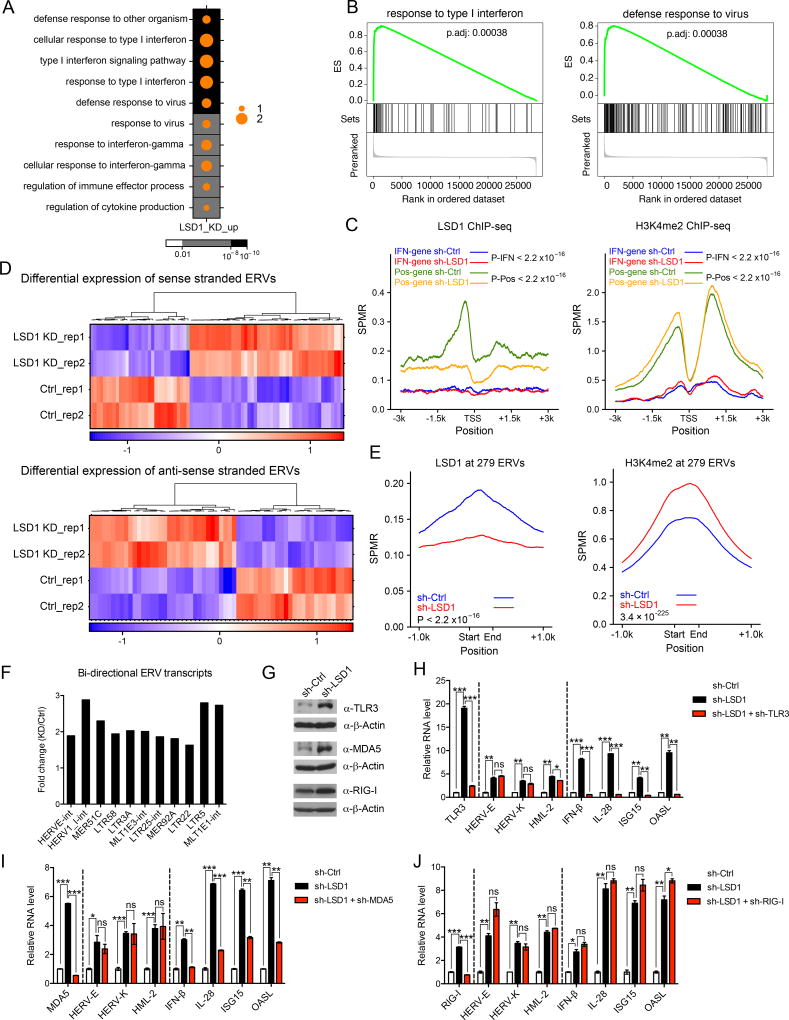
Figure 1. LSD1 restrains intracellular dsRNA stress and IFN activation.
(A) A dot map showing top 10 terms in GO analysis of up-regulated genes (log2(FC-KD/Ctrl) > 1 and FDR < 0.05) in LSD1 KD versus control MCF-7 cells. FC-fold change. Background color and dot size represent FDR and log2 transformed odds ratio separately.
(B) GSEA analysis in LSD1 KD versus control MCF-7 cells.
(C) LSD1 and H3K4me2 ChIP-seq signals at promoter regions of 125 induced IFN/antiviral responsive genes (IFN-gene, log2(FC-KD/Ctrl) > 0 and FDR < 0.05) or selected 537 genes with LSD1 peaks as positive control (Pos-gene) in control and LSD1 KD cells.
(D) Heatmaps for differential expression (FDR < 0.05) of sense or antisense transcripts of ERVs between control and LSD1 KD cells.
(E) LSD1 and H3K4me2 ChIP-seq signals at genomic loci of 8593 individual ERVs from 279 ERV subfamilies in control and LSD1 KD cells.
(F) Fold changes of a number of representative bi-directional ERV transcripts in LSD1 KD versus control cells determined by directional RNA-seq.
(G) Immunoblots of TLR3, MDA5 and RIG-I in MCF-7 cells.
(H–J) The RT-qPCR analysis of transcripts of selected ERVs, IFNs and ISGs in MCF-7 cells transduced with shRNA against scramble, LSD1 or LSD1 plus TLR3 (H), MDA5 (I) or RIG-I (J). The RT-qPCR data were normalized to GAPDH and presented as fold changes of gene expression in the test sample compared to the control, representing two to three independent experiments. Error bars represent standard deviation (SD) between two replicate samples in one experiment. *p < 0.05, **p < 0.01, ***p < 0.001, ns, not significant, as determined by unpaired t-test.

