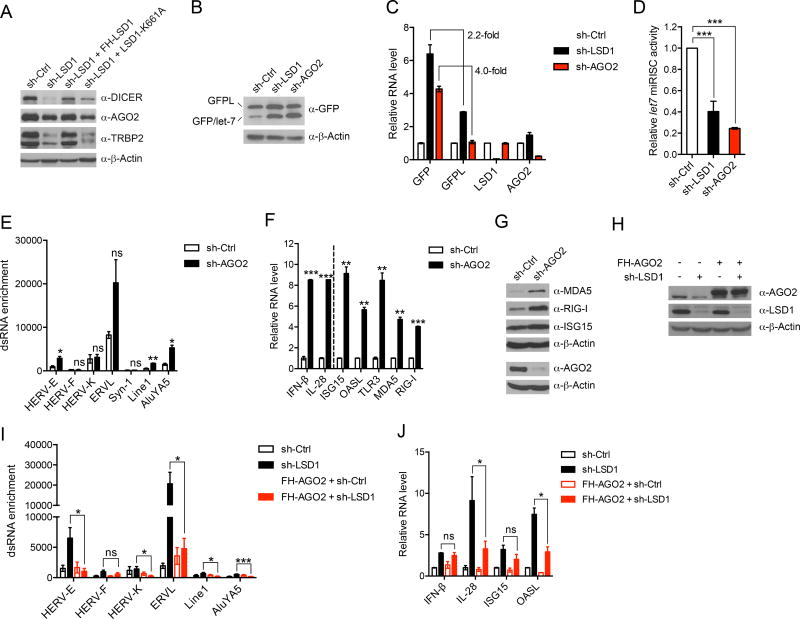
Figure 2. LSD1 inhibition suppresses the expression of RISC components, contributing to dsRNA stress.
(A) Immunoblots of RISC components in MCF-7 cells transduced with shRNA against scramble or LSD1, and rescued with either WT LSD1 or catalytically compromised LSD1-K661A.
(B–D) U2OS stable cell line expressing dual reporters GFPL/GFP-let-7 was transduced with shRNA against scramble, LSD1 or AGO2. The expression of GFPL and GFP was measured by immunoblot (B) and RT-qPCR (C). The ratios of GFPL over GFP protein in different samples from five repeats for sh-LSD1 and two repeats for sh-AGO2 were calculated and the ratio in sh-Ctrl sample was considered as 100% miRISC activity (D).
(E) The dsRNA enrichment of a few retrotransposons assessed by RNase A digestion and RT-qPCR analysis.
(F and G) The expression of IFNs and ISGs in control and AGO2 KD MCF-7 cells analyzed by RT-qPCR (F) and immunoblot (G).
(H–J) The measurement of AGO2 and LSD1 protein expression by immunoblot (H), dsRNA enrichment of a few retrotransposons (I), and RNA levels of IFNs and ISGs by RT-qPCR (J) in MCF-7 cells with indicated manipulations.
Error bars represent SD between duplicates (C, E and F) or triplicates (J) in one of two experiments, or standard error of the mean (SEM) from five experiments (I). *p < 0.05, **p < 0.01, ***p < 0.001, ns, not significant, as determined by unpaired t-test.
Also see Figure S3.

