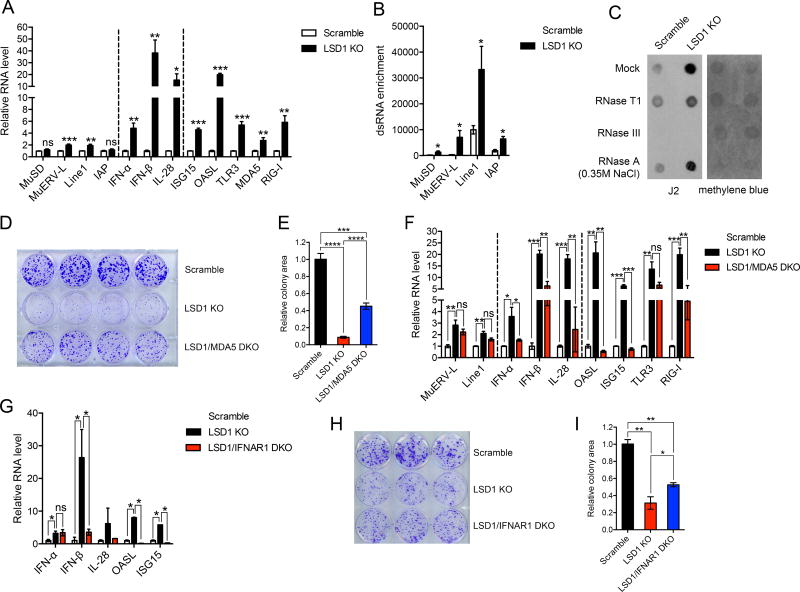
Figure 4. LSD1 abrogation-induced dsRNA stress suppresses tumor cell growth in vitro.
(A) The transcripts of selected retrotransposons, IFNs and ISGs in control and LSD1 KO (clone g5-4) B16 cells analyzed by RT-qPCR.
(B) The dsRNA enrichment of a few retrotransposons in control and LSD1 KO B16 cells assessed by RNase A digestion and RT-qPCR analysis.
(C) Total RNA extract treated with mock, RNase T1, RNase III or RNase A (350 mM NaCl) was dotted on Hybond N+ membranes, visualized by methylene blue staining and immunoblotted with J2 antibody.
(D and E) Colony formation (D) and quantification of colony areas (E) of scramble, LSD1 KO or LSD1/MDA5 DKO B16 cells.
(F) The expression of selected retrotransposons, IFNs and ISGs in scramble, LSD1 KO and LSD1/MDA5 DKO B16 cells analyzed by RT-qPCR.
(G) The expression of IFNs and ISGs in scramble, LSD1 KO and LSD1/IFNAR1 DKO B16 cells analyzed by RT-qPCR.
(H and I) Colony formation (H) and quantification of colony areas (I) of scramble, LSD1 KO or LSD1/IFNAR1 DKO B16 cells.
Error bars represent SEM from three (A and B) or two (F) experiments, or representing SD between duplicates (G), quadruplicates (E) or triplicates (I) in one of two experiments. *p < 0.05, **p < 0.01, ***p < 0.001, ****p < 0.0001, ns, not significant, as determined by unpaired t-test.
Also see Figures S4 and S5.

